| Next || Previous || Top |
USER_GRAPH
This keyword data block is used to create charts of simulation results. The data block defines the data to be charted and the parameters that control the appearance of the chart. Data to be plotted are defined with Basic programs. Observations or other data points can be added to a chart from user-specified files. Multiple charts may be defined for one or more simulations by using multiple
USER_GRAPH
data blocks with different identifying numbers. Different data may be added to a chart in a subsequent simulation by defining a data block with the same identifying number, but with a different Basic program to define the variables to be plotted. A new chart may be defined with the same identifying number if an intervening USER_GRAPH data block includes the identifier -detach. Each chart is a different program thread; once detached, the thread is still running, the chart is still viewable, and its data can be inspected or written to file, but no new data can be added. After a chart is detached, a new USER_GRAPH data block with the same identifying number will generate a new chart.
The keyword follows the syntax of the
USER_GRAPH
data block in PHREEQC for Windows (Post, 2012) and relies on John Champion’s zedgraph software (http://sourceforge.net/projects/zedgraph, accessed May 18, 2012).
USER_GRAPH
is not available in the standard distribution of the Linux version of PHREEQC, but can be implemented on a Linux computer by installing wine; using winetricks to install dotnet20, dotnet20sp2, vcrun2008, and gdiplus; and running PHREEQC compiled for windows with #
define MULTICHART
.
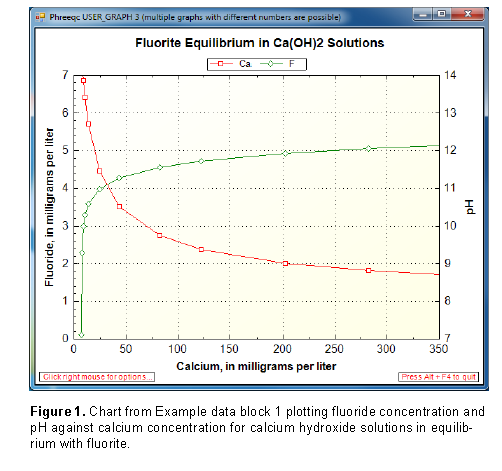
Example data block 1
Line 0: USER_GRAPH 3 Plots F and pH against Ca concentration
Line 1: -headings F pH
Line 2: -axis_titles "Calcium, in milligrams per liter" \
"Fluoride, in milligrams per liter" "pH"
Line 3: -chart_title "Fluorite Equilibrium in Ca(OH)2 Solutions"
Line 4: -axis_scale x_axis 0 350 50 25
Line 4a: -axis_scale y_axis 0 7 1
Line 4b: -axis_scale sy_axis 7 14 0 0
Line 5: -initial_solutions false
Line 6: -connect_simulations true
Line 7: -plot_concentration_vs x
Line 8: -plot_tsv_file filename
Line 9: -batch filename.emf false false
Line 10: -start
Basic: 10 PLOT_XY TOT("Ca")*40.08e3, TOT("F")*19e3, color = Red,\
symbol = Square, symbol_size = 6, y-axis = 1
Basic: 20 PLOT_XY TOT("Ca")*40.08e3, -LA("H+"), color = Green, \
symbol = Diamond, symbol_size = 7, y-axis = 2, \
line_width = 1
Line 11: -end
Line 0a: USER_GRAPH 4
Line 12: -detach
Line 0b: USER_GRAPH 1
Line 13: -active false
Explanation 1
Line 0:
USER_GRAPH
[
number
] [
description
]
USER_GRAPH
is the keyword for the data block.
number
--A positive number designates the user-graph definition. Default is 1.
description
--Optional comment that describes the user-graph chart. The
description
will appear in the title of the chart window.
Line 1:
-headings
labels
-headings
--Identifier provides labels for chart lines. The labels are separated by spaces and correspond with the order that Y and secondary Y curves are calculated with PLOT_XY Basic statements. Optionally,
heading
,
headings
, or
-h
[
headings
].
labels--List of labels, one for each of the curves. In Example data block 1 (see Basic lines 10-20), “F” corresponds to the first PLOT_XY curve, and “pH” corresponds to the second PLOT_XY curve. The labels can be changed in subsequent simulations for proper identification of the parameters graphed (without need of repeating the Basic statements that define the data to be plotted).
Line 2:
-axis_titles
label
1
label
2
label
3
-axis_titles
--Identifier provides labels for the X, Y, and secondary Y axes. Optionally,
axis_titles
or
-a
[
xis_titles
].
label
1
--Label printed below the chart along the X axis.
label
2
--Label printed to the left of the chart along the Y axis.
label
3
--Label printed to the right of the chart along the Y2 axis.
Line 3:
-chart_title
title
-chart_title
--Identifier provides a title that is printed at the top of the chart. Optionally,
chart_title
or
-c
[
hart_title
].
title
--Title for the chart.
Line 4:
-axis_scale
(
x_axis
,
y_axis
, or
sy_axis
) [(
min
or
auto
)
[(
max
or
auto
) [(
major
or
auto
) [(
minor
or
auto
) [
log
]]]]]
-axis_scale
--Identifier provides parameters for scaling the X, Y, or secondary Y axis. If less than five items are listed, the missing scaling parameters are determined by default algorithms. If
axis_scale
is not specified, the program will adjust the scale to a range that displays all the data points. Optionally,
axis_scale
or
-axis_s
[
cale
].
x_axis
,
y_axis
, or
sy_axis
--Selects the axis for which scaling parameters are provided: X, Y, or secondary Y, respectively.
min
or
auto
--The minimum value for the axis, determined automatically if
auto
is specified.
max
or
auto
--The maximum value for the axis, determined automatically if
auto
is specified.
major
or
auto
--The spacing of major tick marks for the axis, determined automatically if
auto
is specified.
minor
or
auto
--The spacing of minor tick marks for the axis, determined automatically if
auto
is specified.
log
--If specified, axis is scaled logarithmically.
Line 5:
-initial_solutions
[(
True
or
False
)]
-initial_solutions
--Identifier selects whether to plot results from initial solution, initial exchange, initial surface, and initial gas-phase calculations. Default is
false
if
-initial_solutions
is not included. Optionally,
initial_solutions
or
-i
[
nitial_solutions
].
(
True
or
False
)--If
true
, results of initial calculations are plotted on the chart; if
false
, results of initial calculations are not plotted on the chart. If neither
true
nor
false
is entered on the line,
true
is assumed. Optionally,
t
[
rue
] or
f
[
alse
].
Line 6:
-connect_simulations
[(
True
or
False
)]
-connect_simulations
--Identifier selects whether to retain curve properties (colors, symbols, line widths) in subsequent simulations, or in subsequent shifts for transport and advection simulations. Default value is
true
if
-connect_simulations
is not included. Optionally,
connect_simulations
or
-co
[
nnect_simulations
].
(
True
or
False
)--If
true
, curve properties are retained for each additional simulation; if
false
, curve properties will differ with each simulation. If neither
true
nor
false
is entered on the line,
true
is assumed. Optionally,
t
[
rue
] or
f
[
alse
].
Line 7:
-plot_concentration_vs
(
x
or
t
)
-plot_concentration_vs
--Identifier selects whether to plot distance or time on the X axis in advection or transport simulations. Default is
x
if
-plot_concentration_vs is not included
. Optionally,
plot_concentration_vs
or
-p
[
lot_concentration_vs
].
x
or
t
--
x
(or
d
) indicates distance,
t
indicates time.
Line 8:
-plot_tsv_file
filename
-plot_tsv_file
--Identifier selects a file containing data to be plotted on the chart. The first line of the file is a set of headings, one for the X axis, followed by one for each curve to be plotted. All headings and data are tab delimited. It is possible to set curve properties by special values in the first column beginning at line 2 in the file. Up to five lines of special values may be defined; each special value is followed by settings for each curve (tab delimited). The special values are “color”, “symbol”, “symbol_size”, “line_width”, and “y_axis”. Legal values for these settings are described in the explanation for Basic line 10. The data lines follow the lines that define special values; each data line has an X value in the first column followed by Y values for each curve; missing values are indicated by consecutive tab characters. Data from multiple files can be added to the chart by using multiple instances of Line 8. Optionally,
plot_tsv_file
or
-plot_t
[
sv_file
].
filename
--Name of the file containing data to be plotted. The program stops with an error message if the file is not found. It is necessary to give the full path name for the file if the working directory is not the same as the directory that contains the file with data to be plotted.
Line 9:
-batch
[filename.suffix
[(
True
or
False
) [(
True
or
False
)]]]
-batch
--This identifier is used to close the chart automatically at the end of the run, and optionally, save the chart to file with or without the yellow background for the chart area. If
-batch
is defined, then the chart will be closed automatically at the end of the run. Optionally,
batch
or
-b
[
atch
].
filename.suffix
--If
filename.suffix
is entered following
-batch
, then a chart file of type suffix will be saved at the end of the run. Suffix may be any of the following: emf, bmp, jpeg, jpg, png, bmp, or tiff. If
filename.suffix is not entered, then the chart will not be saved to a file at the end of the run.
Note that if
-batch
is not defined, the chart can be saved by right clicking on the chart and choosing the “Save image as...” option.
(
True
or
False
)--If
true
is entered following
filename.suffix, then the yellow background will be included in the saved chart; if
false
is entered
following
filename.suffix, then the saved chart will have no colored background.
If neither
true
nor
false
is entered on the line,
true
is assumed. Optionally,
t
[
rue
] or
f
[
alse
].
(
True
or
False
)--If
true
is entered
, then the grid lines will be included in the saved chart; if
false
is entered then the saved chart will have not have grid lines.
If neither
true
nor
false
is entered on the line,
true
is assumed. Optionally,
t
[
rue
] or
f
[
alse
].
Line 10:
-start
-start
--Indicates the start of the Basic program. Optional.
Basic:
numbered Basic statement
numbered Basic statement
--A valid Basic language statement that must be numbered. The statements are evaluated in the order of the line numbers. Statements and functions that are available through the Basic interpreter are listed in The Basic Interpreter, tables 7 and 8.
Basic:
number
PLOT_XY
expression
1
, expression
2
[,
color =
color
]
[,
symbol =
symbol
]
[,
symbol_size =
i
] [,
line_width =
j
] [,
y-axis =
k
]
number
--Number for a Basic statement.
PLOT_XY--Basic command that sets the X and Y values of a data point for a curve in the chart.
expression
1
--Basic expression that evaluates to a number for the X value of a data point. Must be followed by a comma to separate it from the Y value.
expression
2
--Basic expression that evaluates to a number for the Y value of a data point.
color =
color
--Option that sets the color for the data points. Legal values for
color
are Red, Green, Blue, Orange, Magenta, Yellow, Black, Cyan, Brown, Lime, and Gray (lower case is permitted). (Additional colors as defined in Microsoft .NET 2 also may be used, see http://msdn.microsoft.com/en-us/library/aa358802%28v=VS.85%29.aspx, accessed May 18, 2012). If the option is not specified, the colors for curves will cycle sequentially through the listed colors.
symbol =
symbol
--Option that sets the symbol for the data points. Legal values for
symbol
are Square, Diamond, Triangle, Circle, XCross, Plus, Star, TriangleDown, HDash, VDash, and None (spelled exactly as noted). If the option is not specified, the symbols for curves will cycle sequentially through the listed symbols.
symbol_size =
i
--Option that sets the symbol size for the data points. The
i
parameter is an integer greater than or equal to zero. Default is 6. The symbol is not plotted if i = 0 (similar to symbol = None).
line_width =
j
--Option that sets the line width for the curve. The
j
parameter is an integer greater than or equal to zero. Default is 1. The line is not plotted if j = 0.
y_axis =
k
--Option that sets the Y axis for the data points. If
k
is 1, the data are plotted relative to the primary Y axis; if
k
is 2, the data are plotted relative to the secondary Y axis.
Line 11:
-end
-end
--Indicates the end of the Basic program. Optional. Note the hyphen is required to avoid a conflict with the keyword
END
.
Line 12:
-detach
-detach
--Indicates that no more data will be added to the chart and that the identifying number is available for a new
USER_GRAPH
definition. The chart window remains visible and all mouse functions for the chart remain functional.
Line 13:
-active
[(
True
or
False
)]
-active
--Allows plotting of data to the chart to be suspended or resumed. Default is
true
if
-active
is not included.
(
True
or
False
)--If
false
, plotting of data is suspended; if
true
, plotting is resumed. If neither
true
nor
false
is entered on the line,
true
is assumed. Optionally,
t
[
rue
] or
f
[
alse
].
Notes 1
Example data block 1 defines a chart by using PLOT_XY Basic statements, whereas Example data block 2 (below) defines the same chart by using GRAPH_X, GRAPH_Y, and GRAPH_SY Basic statements. One, or a combination of these two types of Basic statements, is required to obtain a plot; all other identifiers are optional. PLOT_XY statements are useful for plotting curves when the X-axis values differ for the variables in the same reaction or transport step, and for controlling curve properties: colors, symbols, and line widths. The Basic program may contain any legitimate numbered Basic statements in addition to the lines containing PLOT_XY. Basic statements are evaluated in numerical order. Statements and functions that are available through the Basic interpreter are listed in The Basic Interpreter, tables 7 and 8.
The PLOT_XY command is followed by a pair of expressions that evaluate to the X and Y values for a data point of a curve. The point may be relative to the primary Y axis (
y-axis = 1
) or the secondary Y axis (
y-axis =
2). The characteristics of the symbols and lines for a curve can be specified with the options
color
,
symbol
,
symbol_size
, and
line_width
. The options require an equals sign and may be separated by commas or spaces.
Identifier
-active
allows activation and deactivation of a chart for sequences of simulations during a run. Plotting of data in a specific chart is interrupted by setting
-active
false. Plotting can be resumed in later simulations by setting
-active
true. Identifier
-detach
will stop plotting of a specific chart during the remaining simulations and permits redefinition of a chart with the same number. Plotting of all the charts can be interrupted and restarted with
PRINT
;
-user_graph
false / true.
The labels defined with
-headings
will be used for labeling curves in subsequent simulations until redefined. For example, the simulation in Example block 1 may be repeated for 50 °C in the same run. F and pH from that run may then be labeled with
USER_GRAPH
;
-heading
F(50C) pH;
END
.
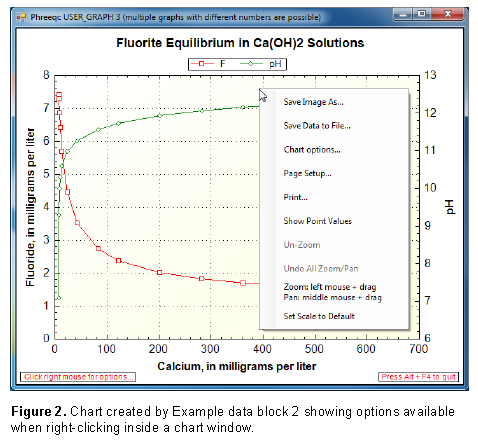
Right-clicking on the window of a chart created by
USER_GRAPH
will display a number of options for manipulating the chart, as shown in figure 2.
Save Image As...--Allows the image to be saved in a variety of graphic formats.
Save Data to File...--Saves the X and Y values of the curves to a user-selected file.
Chart options...--Allows showing or hiding red hints boxes, colored chart background, and chart grid lines.
Page Setup...--Allows the page to be formatted for printing (alternatively, use Print...).
Print...--Prints the chart. The graphics quality is excellent if a PDF printer is selected.
Show Point Values--Displays the X-Y values of the point under the mouse cursor.
Zoom: left mouse + drag--Pressing and dragging the left mouse button will draw a rectangle; the rectangle will be enlarged to the plot window when the button is released.
Pan: middle mouse + drag--Rolling the middle mouse button up or down changes the scales of the axes. Pressing the middle mouse and dragging the mouse pans the viewable area of the chart.
Un-Zoom/Un-Pan--Undoes last zoom or pan. The option changes depending on whether the last operation was a zoom or a pan.
Undo All Zoom/Pan--Returns to the original scaling for the chart.
Set Scale to Default--Scales the axes to values that will display all the data points. This is the default scaling that appears when the identifier
-axis_scale
is not used.
Example data block 2
Line 0: USER_GRAPH 5 Uses graph_x, graph_y, and graph_sy
Line 1: -headings Ca F pH
Line 2: -axis_titles "Calcium, in milligrams per liter" \
"Fluoride, in milligrams per liter" "pH"
Line 3: -start
Basic: 10 GRAPH_X TOT("Ca") * 40.08e3
Basic: 20 GRAPH_y TOT("F") * 19e3
Basic: 30 GRAPH_SY -LA("H+")
Line 10: -end
Explanation 2
Line 0:
USER_GRAPH
[
number
] [
description
]
USER_GRAPH
is the keyword for the data block.
number
--A positive number designates the user-graph definition. Default is 1.
description
--Optional comment that describes the user-graph chart. The
description
will appear in the title of the chart window.
Line 1:
-headings
labels
-headings
--Identifier provides labels for chart curves. The labels are separated by spaces and correspond with the order of the items calculated with Basic statements. Unlike Example data block 1, the headings include an entry for the item plotted on the X axis. Optionally,
heading
,
headings
, or
-h
[
headings
].
labels--List of labels, one for the variable plotted on the X axis and one for each of the curves. In Example data block 2 (see Basic lines 10-30), “Ca” corresponds to the X-axis variable, “F” corresponds to the Y-axis variable, and “pH” corresponds to the secondary Y-axis variable. The labels can be changed in subsequent simulations for proper identification of the parameters graphed (without need of repeating the Basic statements that define the data to be plotted).
Line 2:
-axis_titles
label
1
label
2
label
3
Same as Line 2 in Example data block 1.
Line 3:
-start
-start
--Indicates the start of the Basic program. Optional.
Basic:
numbered Basic statement
numbered Basic statement
--A valid Basic language statement that must be numbered. The statements are evaluated in the order of the line numbers. Statements and functions that are available through the Basic interpreter are listed in The Basic Interpreter, tables 7 and 8.
Basic:
number
GRAPH_X
expression
number
--Number for a Basic statement.
GRAPH_X--Basic command that sets the X value of a data point for a curve of the chart. A point on a curve is defined by an X-Y pair, where the X value is defined by GRAPH_X and the Y value is defined by GRAPH_Y or GRAPH_SY.
expression
--Basic expression that evaluates to a number.
Basic:
number
GRAPH_Y
expressions
number
--Number for a Basic statement.
GRAPH_Y--Basic command that sets the Y value of a data point for a curve on the primary Y axis of the chart. Multiple Y curves can be defined on the same line by defining multiple comma-separated expressions.
expressions
--List of one or more Basic expressions that evaluate to numbers.
Basic:
number
GRAPH_SY
expressions
number
--Number for a Basic statement.
GRAPH_SY--Basic command that sets the Y value of a data point for a curve on the secondary Y axis of the chart. Multiple secondary Y curves can be defined on the same line by defining multiple comma-separated expressions.
expressions
--List of one or more Basic expressions that evaluate to numbers.
Line 10:
-end
-end
--Indicates the end of the Basic program. Optional. Note the hyphen is required to avoid a conflict with the keyword
END
.
Notes 2
Both PLOT_XY and GRAPH_X, GRAPH_Y, and GRAPH_SY statements can be used to define curves in the same Basic program. GRAPH_X, GRAPH_Y, and GRAPH_SY statements provide the more concise syntax, especially for multiple curves, which can be defined with a single GRAPH_Y or GRAPH_SY statement. However, the PLOT_XY allows X values to be defined individually for each curve and the colors, symbols, and lines can be set explicitly with command options.
When using both PLOT_XY and GRAPH_X, GRAPH_Y, and GRAPH_SY statements in the same Basic program, the order of the statements determines the order in which the headings must be defined. Headings are associated with each PLOT_XY statement, the GRAPH_X statement, and each expression of GRAPH_Y and GRAPH_SY statements in the order in which they occur in the Basic program.
Example problems
The keyword
USER_GRAPH
is used in example problems 2, 5, 6, 7, 8, 9, 10, 11, 12, 13, 14, 15, 17, 19, 20, 21, and 22.
| Next || Previous || Top |