| Next || Previous || Top |
Example 22--Modeling Gas Solubilities: CO
2
at High Pressures
The solubility of gas i is given by  , where m is the molality, γ is the activity coefficient in water, KH is the equilibrium constant, P is the partial pressure, and φ is the fugacity coefficient (the activity coefficient in the gas phase). PHREEQC calculates the fugacity coefficient with the Peng-Robinson equation of state (Peng and Robinson, 1976) from the critical pressure and temperature, and the acentric factor of the gas in a gas mixture to obtain the limiting volume and the attraction factor in the Van der Waals equation. The fugacity coefficient is close to 1 when the total pressure of the gas phase is less than about 10 atm, and it can be neglected in the solubility calculation. At higher pressures, the effect can be substantial, as shown for CO2 in figure 27. At low pressures, the concentration of CO2 increases near-linearly with pressure. At 25 °C and pressures higher than 62 atm, the concentration increases more gradually because the fugacity coefficient drops rapidly.
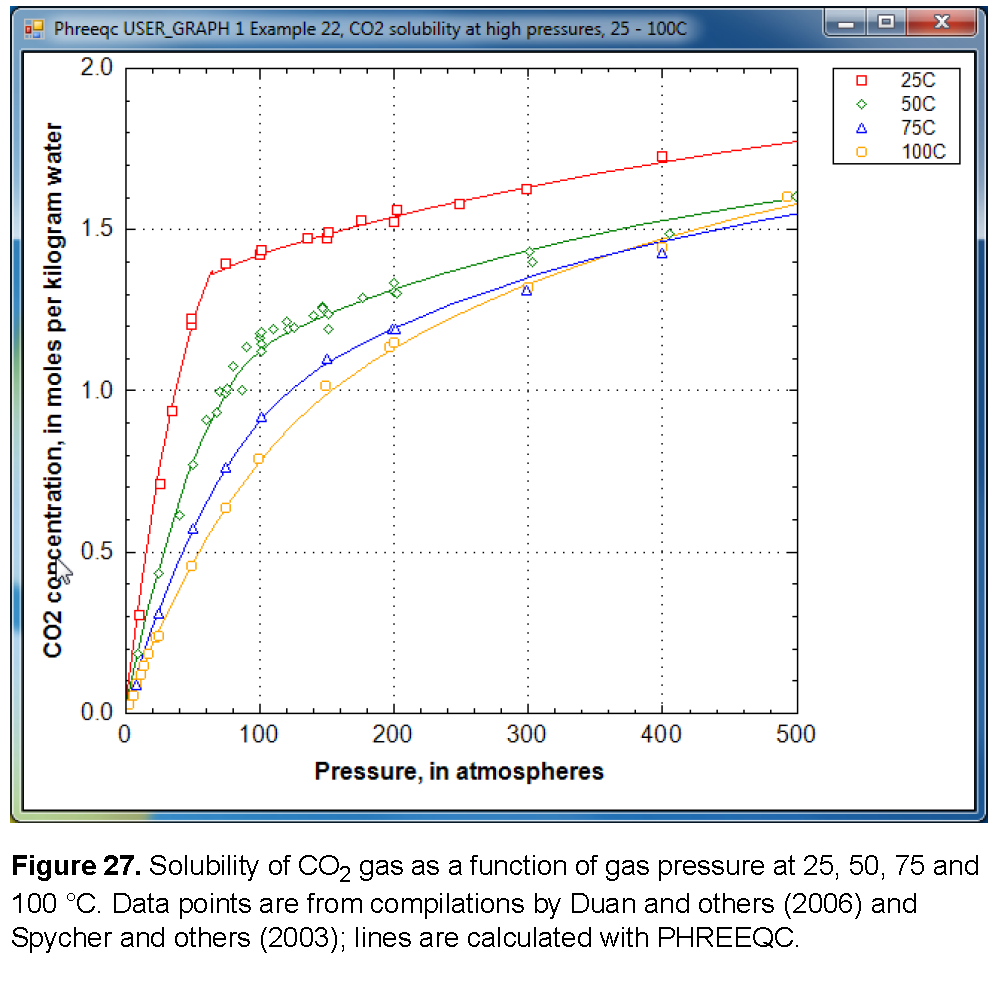
The aqueous concentrations for a point in figure 27 can be calculated by initial equilibrium in the SOLUTION:
SOLUTION
pH 3 charge
-pressure 1000
C(4) 100 CO2(g) 3 # 1000 atm
END
or with EQUILIBRIUM_PHASES:
SOLUTION
-pressure 1000
EQUILIBRIUM_PHASES
CO2(g) 3 # 1000 atm
END
For these two options the solutions or the equilibrium phases need to be redefined for each pressure, either by explicitly repeating the keywords in the file, or by writing an input file in Basic and reading it in with INCLUDE$.
Another option is to use a fixed-volume GAS_PHASE and let the pressure increase by adding CO2 with keyword REACTION (table 61). This option permits other gases to be included; for example, H2O, for which the pressure and fugacity coefficient also will be calculated. Furthermore, the pressure of the solution does not need to be defined as in the options above because it will change with the pressure of the gas phase.
Table 61. Input file for example 22.
TITLE Example 22.--Compare experimental CO2 solubilities at high CO2 pressure
|
with Peng-Robinson calc'ns with fixed-volume gas_phase, 25, 50, 75, 100 oC.
|
SOLUTION 1
|
GAS_PHASE 1
|
-fixed_volume
|
CO2(g) 0
|
H2O(g) 0
|
REACTION
|
CO2 1; 0 27*1
|
INCREMENTAL_REACTIONS true
|
|
USER_GRAPH 1 Example 22, CO2 solubility at high pressures, 25 - 100C
|
-plot_tsv_file co2.tsv
|
-axis_titles "Pressure, in atmospheres" \
|
"CO2 concentration, in moles per kilogram water"
|
-axis_scale x_axis 0 500
|
-axis_scale y_axis 0 2
|
-connect_simulations false
|
10 graph_x PR_P("CO2(g)")
|
20 graph_y TOT("C(4)")
|
-end
|
USER_GRAPH 2 Example 22, P-Vm of CO2 gas, 25 - 100C
|
-headings 25C
|
-axis_titles "Molar volume of CO2 gas, in liters per mole" \
|
"CO2 pressure, in atmospheres"
|
-axis_scale x_axis 0 1
|
-axis_scale y_axis 0 500
|
-connect_simulations false
|
10 plot_xy gas_vm, gas_p symbol = None
|
-end
|
END
|
|
USE solution 1
|
USE gas_phase 1
|
USE reaction 1
|
REACTION_TEMPERATURE 2
|
50
|
USER_GRAPH 2
|
-headings 50C
|
END
|
USE solution 1
|
USE gas_phase 1
|
USE reaction 1
|
REACTION_TEMPERATURE 3
|
75
|
USER_GRAPH 2
|
-headings 75C
|
END
|
|
USE solution 1
|
USE gas_phase 1
|
USE reaction 1
|
REACTION_TEMPERATURE 4
|
100
|
USER_GRAPH 2
|
-headings 100C
|
END
|
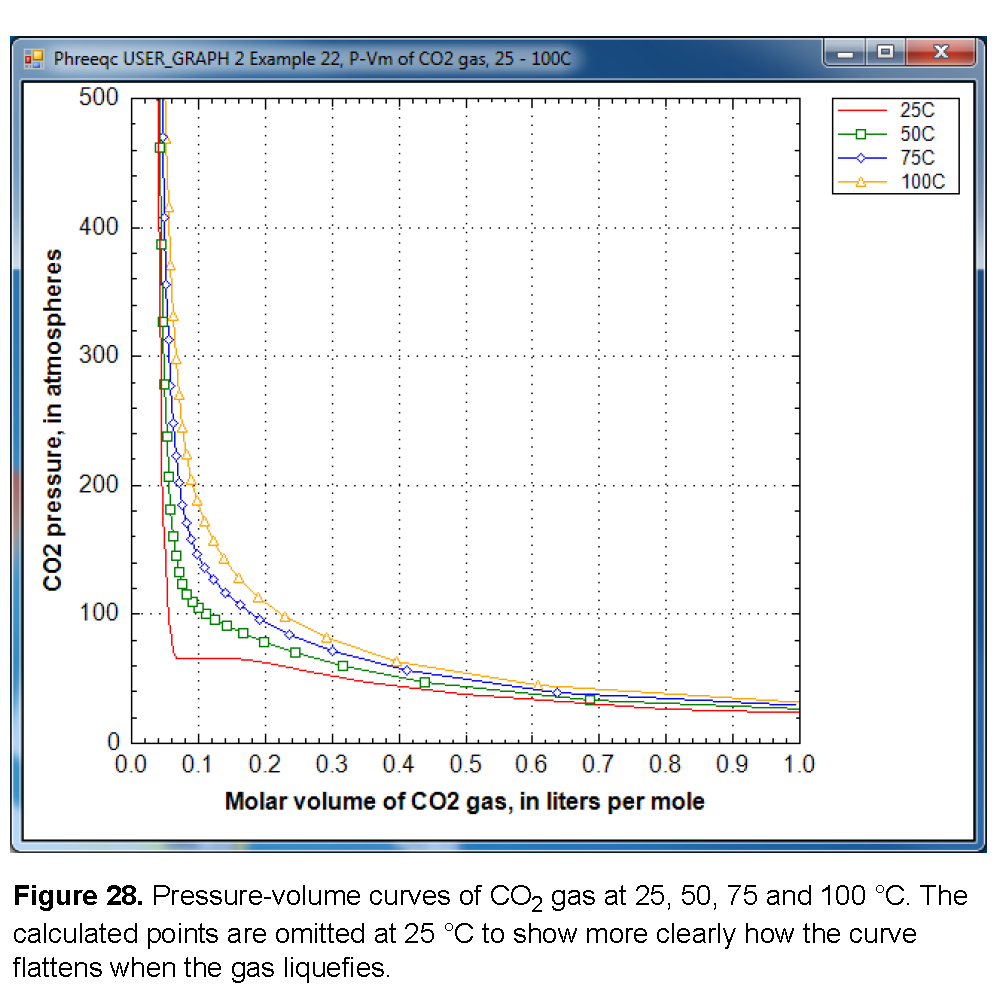
Figure 28 shows a plot of the gas pressure as a function of the molar volume at four temperatures, 25, 50, 75, and 100 °C. At 50 °C and higher, the graph displays a smooth increase of the gas pressure with decreasing volume. However, at 25 °C the curve flattens out between 0.07 and 0.15 L/mol. The constant pressure for decreasing volume indicates that CO
2
gas becomes liquid when it is compressed to less than 0.141 L/mol at 25 °C. At 0.068 L/mol all the gas has been liquefied, and further decrease of the molar volume then results again in pressure increase. The gas/liquid transition appears in the cubic Van der Waals equation (the basis of Peng-Robinson’s equation), when it has three roots at temperatures below the critical temperature of the gas (31 °C for CO
2
gas).
When the pressure is calculated from the molar volume of the gas or the gas mixture, PHREEQC checks whether the equation has three roots. If so, it will test whether another root can be found at a larger molar volume; the root with the maximum pressure will be used as the solution of the equation. Thus, the gas pressure may remain constant (or, possibly even decrease slightly because the parameters in a gas-mixture may change) even when the molar volume decreases. The gas liquefaction may result in small kinks in the calculated solubility curve (calculated by equilibrating a solution with a GAS_PHASE), and one is visible in figure 27 at 65 atm and 25 °C.
| Next || Previous || Top |