This example demonstrates the capabilities of PHREEQC to model the evolution of gas compositions in equilibrium with a solution with a fixed (total) pressure or a fixed volume of the gas phase. In the case of a fixed-pressure gas phase, a gas bubble forms as soon as the sum of the partial pressures of the component gases exceeds the specified pressure of the gas phase. Once the bubble forms, its volume and composition will vary with the extent of reactions. This case applies to gas bubbles forming in surface water or groundwater at a given depth, where the total pressure is constant. With a fixed-volume gas phase, the aqueous solution is in contact with a head space of a fixed volume, which is typical for a laboratory experiment with a closed bottle. The gas phase always exists in this head space, but its pressure and composition will vary with the reactions. Another way to model gas-liquid reactions in PHREEQC is to maintain a fixed partial pressure by using the EQUILIBRIUM_PHASES data block. This fixed-partial-pressure approach is illustrated in this example by fixing the CO2 pressure for a SOLUTION.
Conceptually, an infinite gas reservoir is assumed for the fixed-partial-pressure approach, for example, water in contact with ambient air. In this case, the partial pressure of a gas component remains constant regardless of the extent of reactions. If the gas reservoir is finite and the total pressure is constant, as in gas bubbles in estuarine and lake sediments and in groundwater, then a fixed-pressure gas phase should be used. If the gas reservoir is finite and its volume is constant, as in a bottle with a fixed head-space, then the fixed-volume gas phase is appropriate.
In this example, the fixed-partial-pressure approach is used to define a groundwater in equilibrium with a given CO2 pressure and with calcite. The GAS_PHASE data block is used to model the decomposition of organic matter under fixed-pressure and fixed-volume conditions, with the assumption that carbon, nitrogen, hydrogen, and oxygen are released in the stoichiometry CH 2 O(NH 3 ) 0.07 by the decomposition reaction. Without electron acceptors, the organic matter decomposes to CH4 and CO2, and NH3 and N2. The carbon and nitrogen will react to redox and gas-solution equilibrium in the model, but it should be noted that these redox reactions require bacterial mediation and are almost always in disequilibrium in groundwater systems. Aqueous carbon species are defined in SOLUTION_MASTER_SPECIES and SOLUTION_SPECIES of the default databases for two valence states, carbon(+4) and carbon(-4) (methane); no intermediate valence states of carbon are defined. Aqueous nitrogen may occur in the +5, +3, 0, and -3 valence states, depending on the database. The gas components considered here are water vapor (H2O), carbon dioxide (CO 2 ), methane (CH 4 ), nitrogen (N 2 ), and ammonia (NH 3 ).
In the first simulation, the initial water is groundwater in equilibrium with calcite at a partial pressure of carbon dioxide of 10 -1.5 [log P(CO 2 ) = -1.5]. Pure water is defined with the SOLUTION data block with default values for pH (7.0), pe (4.0), and temperature (25 °C); calcite and carbon dioxide, which dissolve to equilibrium, are defined with EQUILIBRIUM_PHASES. SAVE is used to save the equilibrated solution so that it can be recalled later in the run (table 26). USER_GRAPH data blocks specify data to be plotted, and SELECTED_OUTPUT defines a file ( ex7.sel ) to which data (similar to the plotted data) are written for each calculation. As an alternative to writing the selected output file, the data plotted in the charts can be saved to a file by using the pop-up menu that appears when right-clicking the mouse while the cursor is inside a chart.
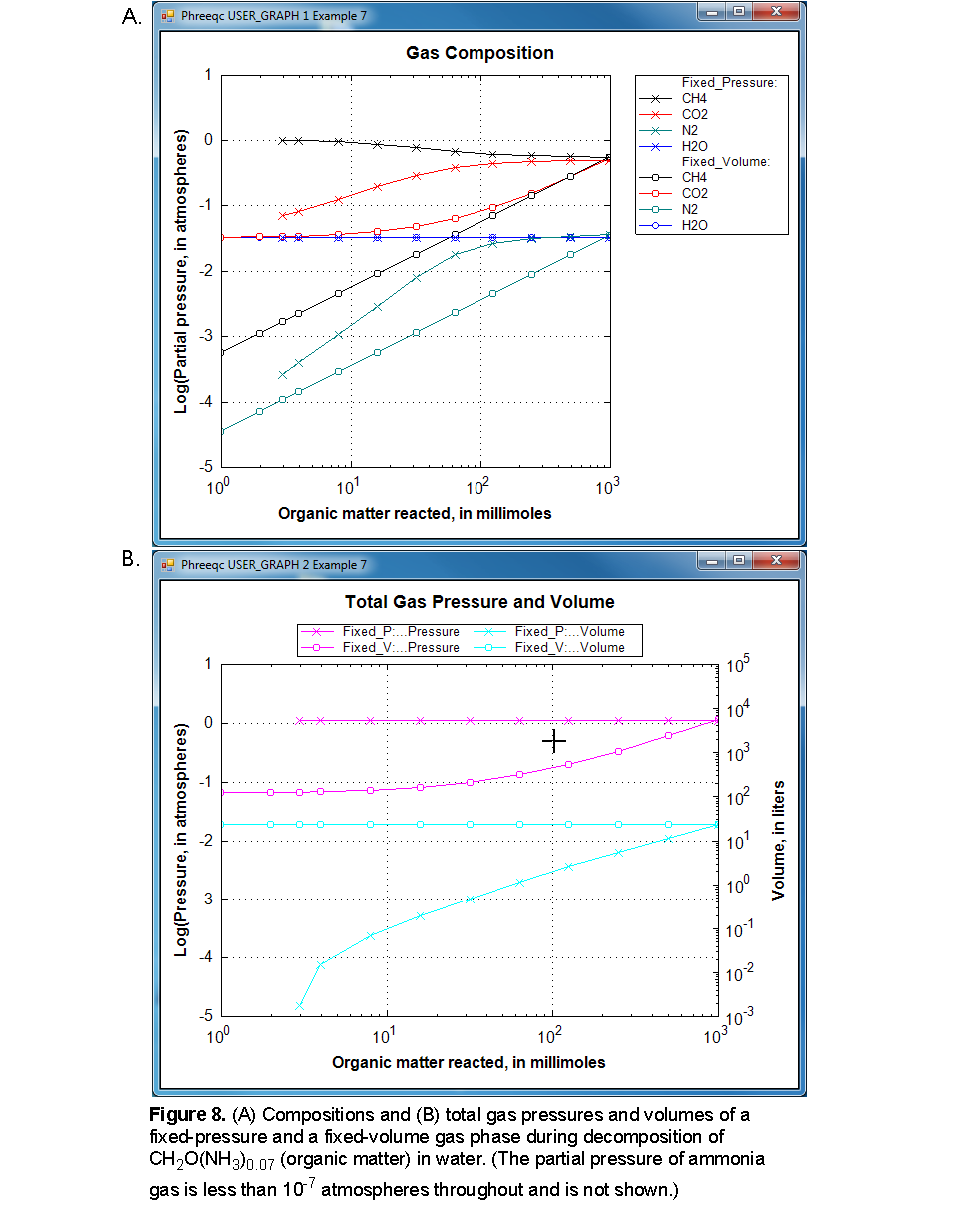
In the second simulation, organic matter decomposes with a carbon to nitrogen ratio of 1:0.07 in reaction steps ranging from 1 to 1,000 mmol (REACTION keyword). A fixed-pressure gas phase will form when the sum of the partial pressures exceeds 1.1 atm; only H2O, CO 2 , CH 4 , N 2 , and NH 3 enter the gas phase, as defined by the GAS_PHASE data block. The third simulation uses the same initial solution and reaction. However, the gas phase starts with H2O and CO2 in equilibrium with the initial solution and has a fixed volume of 23.19 L, which is the final volume of the fixed-pressure gas phase in the previous simulation. After 1,000 mmol of reaction, the fixed-pressure and fixed-volume gas phases have (very nearly) the same pressure, volume, and composition, with slightly higher concentrations in the fixed-volume simulations because H2O(g) and CO2(g) entered the volume in the equilibration stage. At the other reaction increments, the pressure, volume, and composition are different for the two gas phases, except for the pressure of water vapor (fig. 8).
Figure 8 illustrates the two different approaches of GAS_PHASE. For the fixed-pressure gas phase, a bubble forms when nearly 3 mmol of reaction have been added. Initially, the composition reflects the solubility of the gases--more than 90 percent CH 4 and less than 10 percent CO 2 --even though CH4 and CO2 are produced in equal proportion by the reaction. N 2 and NH 3 are minor components (NH 3 partial pressures are less than 10 -7 atm throughout the batch-reaction calculation and are not plotted). The solubility effect lessens as the reaction progresses; CO2 becomes the major carbonate species in the solution as pH decreases. From 200 mmol of reaction onwards, the partial pressures remain nearly constant and the gases reflect the stoichiometry of the organic matter decomposition. The volume of gas produced by the reactions ranges from less than 1 mL at 3 mmol of reaction to 23.19 L after 1,000 mmol of the stoichiometric reaction has been added. The pressure of H2O remains the same throughout because the salinity of the solution remains the same.
For the fixed-volume gas phase, the gas phase exists from the beginning of the reaction (fig. 8). Initially, the gas is H2O and CO 2 , but as the reaction proceeds, CH 4 and N 2 in the ratio 0.5:0.03 enter the gas phase. This ratio occurs because one-half of the C released becomes CH4, and slightly less than one-half of the NH3 becomes N2. The solution becomes acidic because of the CO2 produced; hence, partitioning of CO2 to the gas phase increases (relative to CH4) as the reaction proceeds (fig. 8). In the final stage, the CO 2 and CH 4 partial pressures become nearly equal. All the partial pressures of the fixed-volume gas phases are smaller than the fixed-pressure gas phase up to 1,000 mmol of reaction (except H2O, which remains the same). If the reaction continued beyond 1,000 mmol, the pressure of the fixed-volume gas phase would become greater and greater. Conversely, the volume of the fixed-pressure gas phase is less than the volume of the fixed-volume gas phase until 1,000 mmol of reaction, but would expand further if the reaction continued.