National Water-Quality Assessment (NAWQA) Program
Go to:
Ground Water LUS and MAS Boundaries
Maps of cycle 1 ground water study areas (9.6mb PDF file): The PDF file contains one page size map per network, sorted by study unit. Each map shows BND, TRG if applicable, and wells. Maps were generated at various dates from 2002-2004 so some might not reflect the wells in the current data base. Also, no distinction is made between cycle 1 wells and cycle 2 wells.
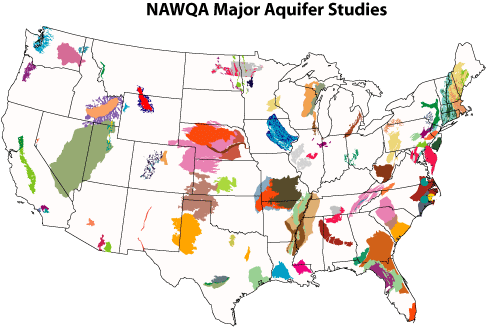
Map of NAWQA Major Aquifer Studies (Feb. 2005):
Total areas (square meters) of LUS and MAS ground water studies:
Metadata ||
CYC1 Areas ||
CYC2 Areas
(updated Feb 2007)
Field Mapped Land use/Land Cover Characterization for Wells
Spatial data for field mapped land use/land cover within 500-m of the well (geodatabases)
Field mapped land use/land cover percentages (dbf files)
GIS Ancillary Data Calculated using National GIS Data Layers
All data files are tab-delimited text files. The point/buffer files are based on the sites in the NAWQAPT site coverage.
We usually process data for these geographic units: 500-m radius circular buffers around sampling points, ground water study area polygons, and sampling points.
500-m Buffers around Sampling Points
The current data sets (most as of October 2006; a couple are more recent, as of June 2008) are here.
Ground Water Study Areas (LUS and SUS)
The current data sets (as of October 2006) are here.
Sampling Points
All use May 2004 version of NAWQAPT. These are NOT in sync with what's been used to update the well buffer data.
| Data Layers for Sampling Points | ||
| Land Use from NLCDE | Metadata | Data |
| Climate | Metadata | Data |
| Hydrologic variables | Metadata | Data |
| Surficial Geology | Metadata | Data |
| Glaciated Quaternary Sediments | Metadata | Data |
| 1990 and 2000 Population density | Metadata | Data |
Old GIS Ancillary Data Calculated using National GIS Data Layers

 U.S. Department of the Interior |
U.S. Geological Survey
[an error occurred while processing this directive]
URL: http://water.usgs.gov
Page Contact Information: Jo Ann M. Gronberg
Page Last Modified: Monday, 13-May-2013 16:23:15 EDT
