National Water-Quality Assessment (NAWQA) Project
Go to:
U.S. GEOLOGICAL SURVEY
Water-Resources Investigations Report 98-4222
Sacramento, California, 1999


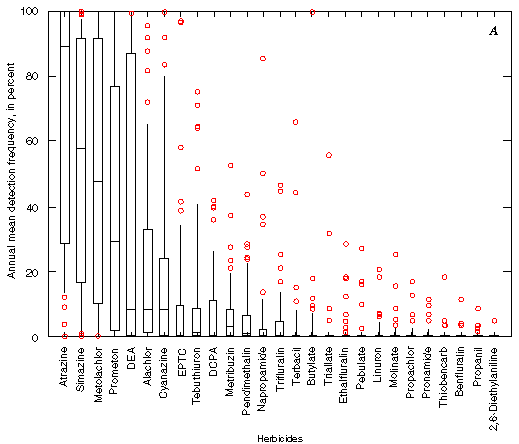
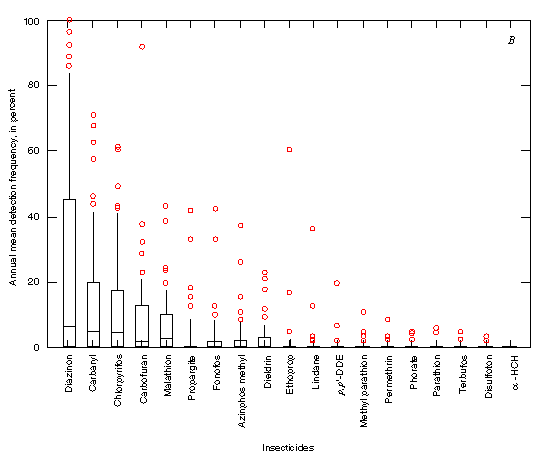
Figure 7. Distribution of annual mean detection frequencies of all
target (A) herbicides and (B) insecticides. Each boxplot
represents the distribution of detection frequencies for a specific compound
among 50 sampling sites for a 1-year period. A common reporting level of 0.01
microgram per liter was used for calculation of detection frequencies for all
compounds. See figure 5A for an explanation of boxplots.