National Water-Quality Assessment (NAWQA) Project
Go to:
U.S. GEOLOGICAL SURVEY
Water-Resources Investigations Report 98-4222
Sacramento, California, 1999
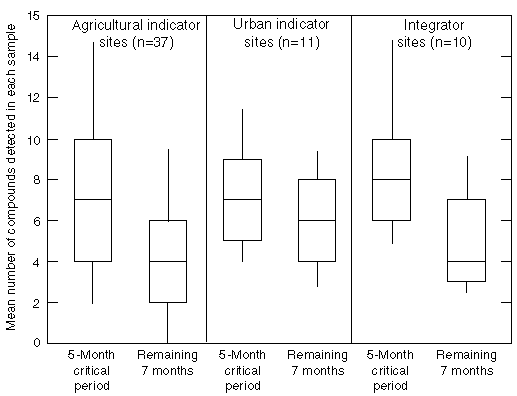
Figure 17. Distribution of the mean number of compounds detected in
each sample at any concentration for a 5-month critical period and for the rest
of the year for each of the three types of sites.
(See figure 5A and associated text for
an explanation of boxplots.)

![]() U.S. Department of the Interior | U.S. Geological Survey
U.S. Department of the Interior | U.S. Geological Survey
URL: http://water.usgs.gov/nawqa/pnsp/pubs/wrir984222/fig17.html
Page Contact Information: gs-w_nawqa_whq@usgs.gov
Page Last Modified: Tuesday, 04-Mar-2014 14:44:35 EST
