National Water-Quality Assessment (NAWQA) Project
Go to:
U.S. GEOLOGICAL SURVEY
Water-Resources Investigations Report 98-4222
Sacramento, California, 1999
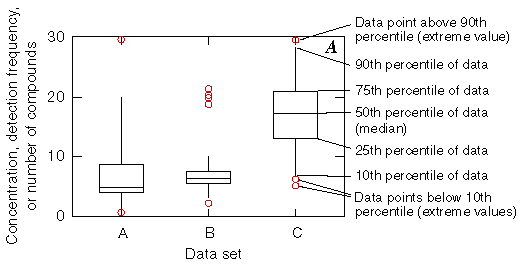
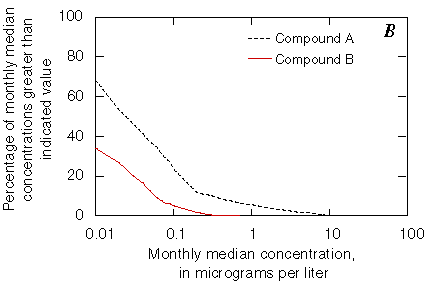
Figure 5. Hypothetical plots as examples of (A) boxplots and
(B) concentration distribution plots. In Figure 5B,
the values on the y-axis show the percentage of monthly median concentrations
greater than the value indicated on the x-axis. For example, 68 percent of
monthly median concentrations of compound A were greater than 0.01 micrograms
per liter, and 6 percent of monthly median concentrations were greater than
1 microgram per liter.

![]() U.S. Department of the Interior | U.S. Geological Survey
U.S. Department of the Interior | U.S. Geological Survey
URL: http://water.usgs.gov/nawqa/pnsp/pubs/wrir984222/fig5.html
Page Contact Information: gs-w_nawqa_whq@usgs.gov
Page Last Modified: Tuesday, 04-Mar-2014 14:44:37 EST
