
Water Resources of the United States
 Visit the USGS Flood Reports page for floods dating back over 100 years.
Click the map above to visit a State-specific flood page (if available), or check out one of these State flood databases:
The USGS provides practical, unbiased information about the Nation's rivers and streams that is crucial in mitigating hazards associated with floods. This site provides information about the USGS activities, data, and services provided during regional high-flow events, such as hurricanes or multi-state flooding events. The USGS response to these events is typically managed by the National Floods Specialist.
|
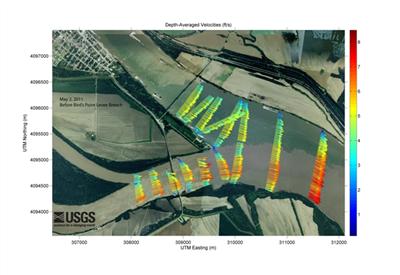
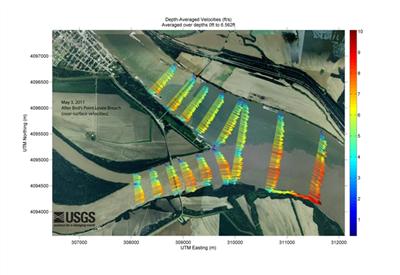
This figure shows depth-averaged velocities in feet per second on May 2, 2011 prior to the Uppder Inflow Breach. Click the image to download a PDF version. |

|
This figure shows depth-averaged velocities in feet per second for the uppermost 2 meters of water on May 2, 2011 prior to the Upper Inflow Breach. Click the image to download a PDF version. |
|
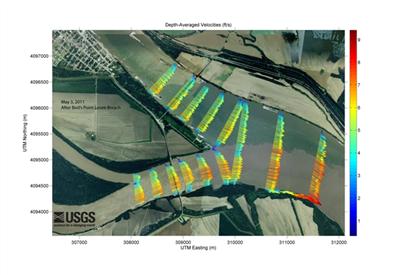
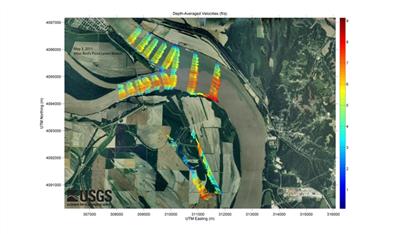
This figure shows depth-averaged velocities in feet per second on May 3, 2011 following the Upper Inflow Breach. Click the image to download a PDF version. |
|
This figure shows depth-averaged velocities in feet per second for the uppermost 2 meters of water on May 3, 2011 following the Upper Inflow Breach. Click the image to download a PDF version. |
|
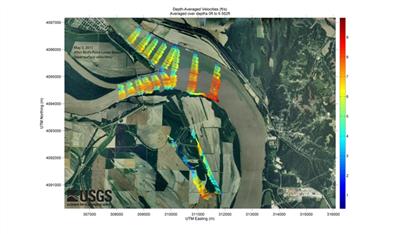
This figure shows depth-averaged velocities in feet per second on May 3, 2011 following the Upper Inflow Breach, including velocity measurements along the breach. Click the image to download a PDF version. |
|
This figure shows depth-averaged velocities in feet per second for the uppermost 2 meters of water on May 3, 2011 following the Upper Inflow Breach, including velocity measurements along the breach. Click the image to download a PDF version. |