Next select "Edit|Show or Hide Image to display the background image. Identify the river at the south end of the model and select it. then Hide the image again. Double-click on the object that represents the river. In the Object Properties dialog box, change the name to "Southern Stream." Change the Number of Z formulas to Two. Make sure the formulas for the Higher Z-coordinate and Lower Z-coordinate are set to Model_Top and Aquifer_Bottom respectively.
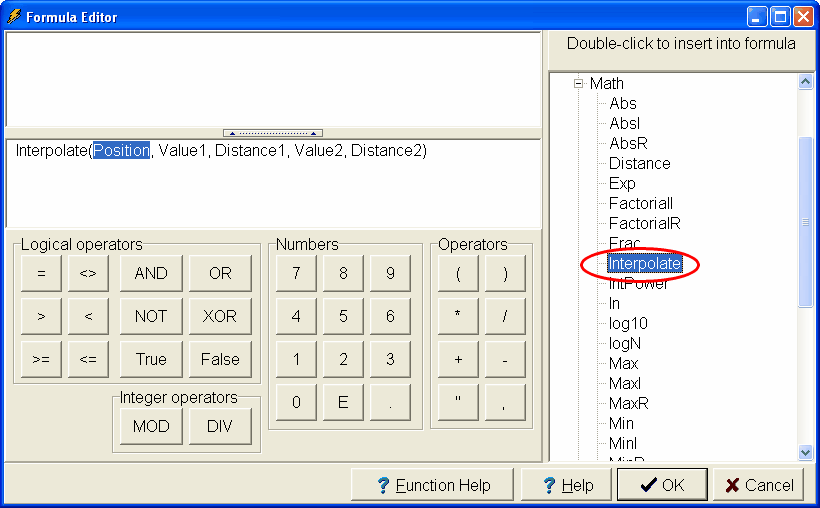
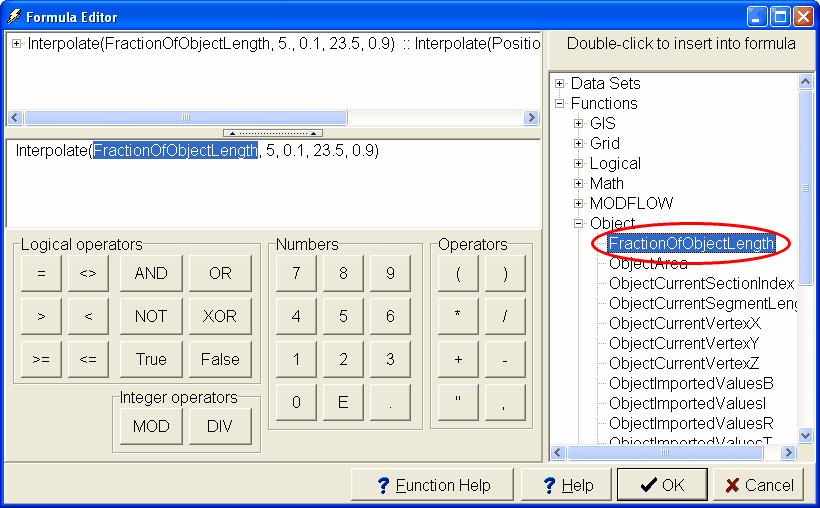
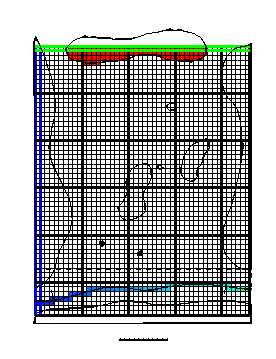
Next change to the MODFLOW Features tab and check the check box for the CHD package. Change the Number of times to 1. Enter 0 and 631152000 as the Starting time and Ending time respectively. The head in the stream varies from 5 near the cross mark near the left end of the stream to 23.5 near the cross mark at the right end of the stream. The cross marks are at approximately 10% and 90% of the length of the object representing the stream. To set up this condition, more than just a number needs to be entered for the formula. An appropriate formula is "Interpolate(FractionOfObjectLength, 5., 0.1, 23.5, 0.9)" To set up this formula, select the cell in the table for Starting head and click on the button in the cell to open the Formula Editor. Expand Functions|Math and double-click on the Interpolate function (fig. 111). (If desired, click on the Function help button to find out more about the Interpolate function.) "Interpolate(Position, Value1, Distance1, Value2, Distance2)" should appear in the Formula text box. When this formula is evaluated, the variable of function entered for "Position" will be evaluated at each cell. Then the function will interpolate (or extrapolate) between "Value1" and "Value2" depending on where "Position" is relative to "Distance1" and "Distance2." The two known head values are 5 and 23.5 so they are entered for Value1 and Value2. Those two values occur at 10% and 90% of the length of the object so Distance1 and Distance2 are 0.1 and 0.9. After entering those value the formula should be "Interpolate(Position, 5, 0.1, 23.5, 0.9)." Finally, select "Position" in the formula and then expand Functions|Object. Double-click on FractionOfObjectLength to insert it in the formula (fig. 112). Once again, the final formula should be "Interpolate(FractionOfObjectLength, 5., 0.1, 23.5, 0.9)." Click the OK button to close the Formula Editor. Then copy the formula to Ending head. (Select the Starting head cell and use Ctrl-C to copy. Then select the Ending head cell and use Ctrl-V to paste.) Click OK to close the Object Properties dialog box. The lake should now be red and the color of the cells in the stream should vary from dark blue on the left to light blue on the right (fig. 113).

Figure 111. Formula Editor with Interpolate function highlighted.

Figure 112. Formula Editor with FractionOfObjectLength function highlighted.

Figure 113. Variation of specified heads along stream.
[Optional] There is another way to specify the variation in head along the object. You can associate values with particular vertices and then use the InterpolatedVertexValue function to interpolate between the vertices. To associate values with particular vertices, first select the object that represents the river. Then select Object|Edit|Vertex Values or click the Edit vertex values  button and double-click on a vertex. The Vertex Values dialog box will appear. In it enter a key name and a value. In this case, you might want to use "Specified Head" as the key name. Double-click on first vertex on the left and use "Specified Head" as the key name and "3" as the value. Then double-click on the last vertex on the right and use "Specified Head" as the key name and "25" as the value. Next click the Select objects
  button and double-click on the object.and use InterpolatedVertexValue("Specified Head") as formula for both the Starting head and the Ending head.