Just as with the Active data set, it is helpful to color the grid with the CHD boundary to make sure that the boundaries are being applied correctly. Select Data|Data Visualization and color the grid with the CHD Ending Head (Found under Boundary Conditions, Observations, and Other Features|MODFLOW CHD). Be sure to click the Apply button. No cells will be colored because the no such boundary cells have been defined yet.
Double-click on the object that represents the lake at the north end of the model. In the Object Properties dialog box, change the name to "Northern Lake." Check Set values of enclosed cells and uncheck Set values of intersected cells. Change the Number of Z formulas to Two. Make sure the formulas for the Higher Z-coordinate and Lower Z-coordinate are set to Model_Top and Aquifer_Bottom respectively.
Next change to the MODFLOW Features tab and check the check box for the CHD package. Change the Number of times to 1. Enter 0 and 631152000 as the Starting time and Ending time respectively. (The times that have been entered in the MODFLOW Time dialog box can be selected from the drop down list or new values can be typed.) The head in the lake is 75 so enter 75 for both the Starting head and Ending head. (The starting head is the head at the beginning of the stress period. The ending head is the head at the end of the stress period.)
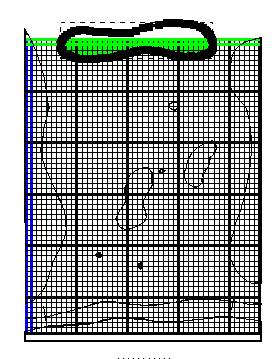
Click the OK button. The cells inside the lake should now be colored green (fig. 110).

Figure 110. Using object to specify northern specified-head boundary.