The next step is assign the cells that are active. Most cells in the model are active but cells outside the domain outline, underlain by impermeable bedrock, or south of the stream should be inactive. To start, color the grid with the Active data set. This helps in checking that any changes that are made have the intended effect. Click the Data Visualization button  to display the Color Grid pane of the Data Visualization dialog box. Select the Active data set (under "Data Sets|Required|Hydrology") and click the Apply button. All the grid cells inside the domain outline will turn blue indicating that they are active active. If desired, the Data Visualization dialog box can be closed.
Next select Data|Edit Data Sets... The Active data set will already be selected. Its Default Formula is "True." Change the Default Formula to "False" and click the Apply button. Now all the cells will be red indicating that none of the cells are active.
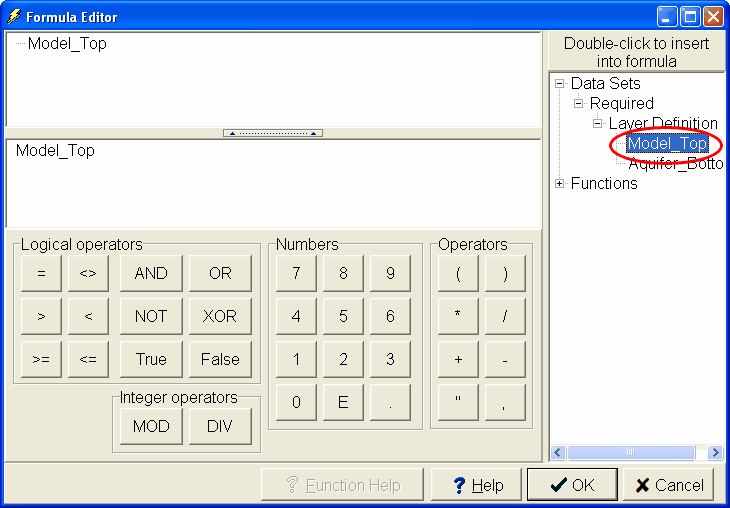
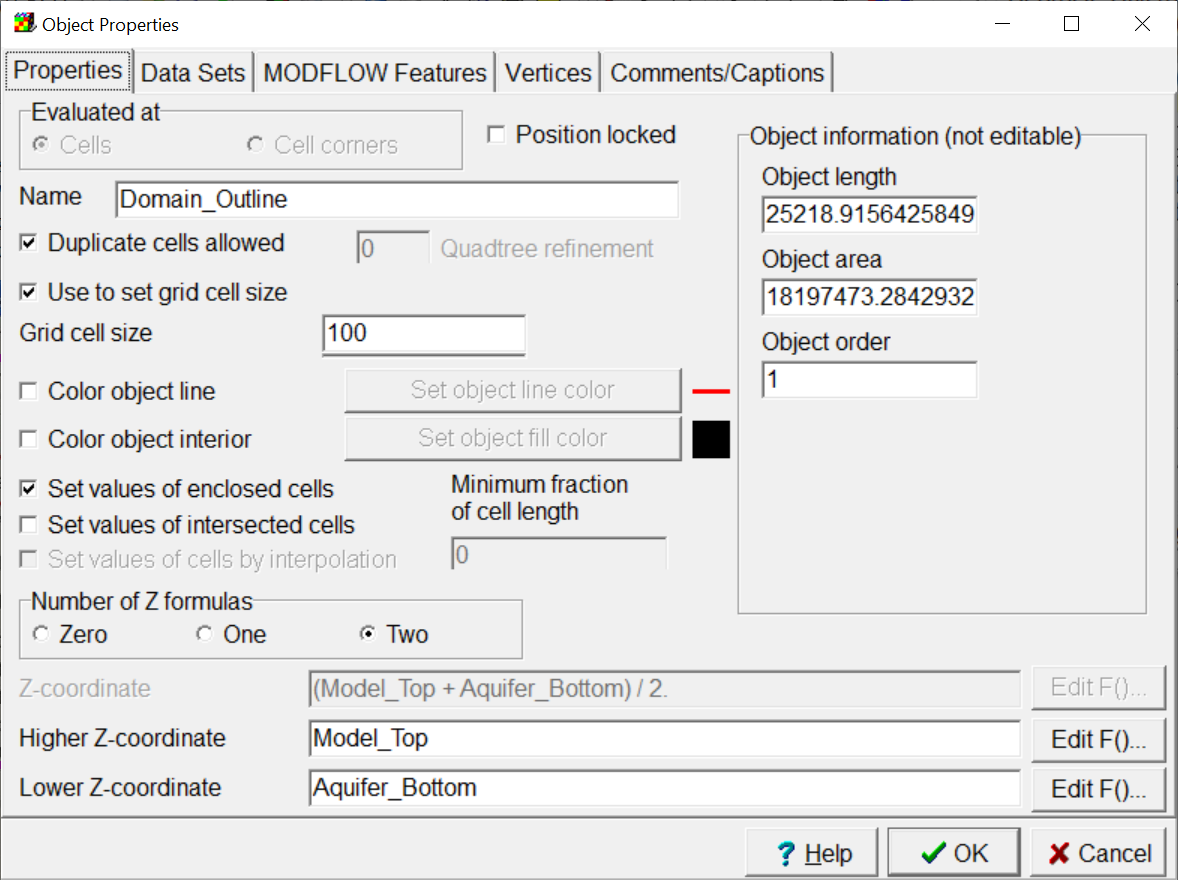
If it is not already selected, select Object|Select Objects  . Next double-click on the object that was used to define the domain outline to open the Object Properties dialog box. Switch to the Data Sets tab. In the tree-view control, open Required and Hydrology and check the check box next to Active. Change the formula for active to "True." Switch back to the Properties tab and locate the Edit F() button next to Higher Z-coordinate and click it. This will open the Formula Editor. On the right, there is a tree-view control. Click on the "+" next to Data Sets to expand it. Then expand Required and Layer Definition. Double-click on Model_Top. Model_Top will replace the selected text in the formula (fig. 103). Click the OK button in the Formula Editor to close it. In a similar way, change the formula for the Lower Z-coordinate to Aquifer_Bottom (fig. 104). These two formulas determine how far the domain outline extends in the Z direction. In this case, the object extends from the top of the model to the bottom of the aquifer. In layer groups with more than one layer, these formulas can be used to restrict an object to a single layer. Click the OK button to close the Object Properties dialog box. Check that the cells inside the domain outline are active and the cells outside it are inactive.

Figure 103. Formula Editor with Model_Top selected.

Figure 104. Object Properties dialog box with expressions for the Z-coordinate formulas already specified