National Water-Quality Assessment (NAWQA) Project
Is more than one management approach needed to control nutrient delivery to the Gulf?
How do these findings relate to the Gulf of Mexico Hypoxia Task Force Action Plan?
What are the contributions of urban sources to the nutrients delivered to the Gulf?
What is SPARROW? |Back to Top|
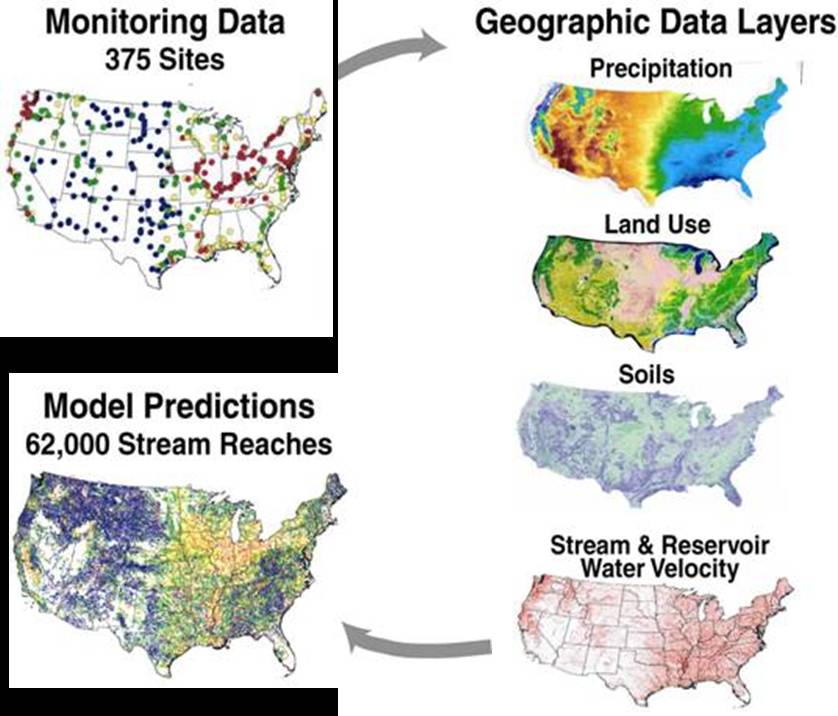
USGS scientists developed SPARROW (Smith and others, 1997) to (a) utilize monitoring data and watershed information to better explain the factors that affect water quality, (b) examine the statistical significance of contaminant sources, environmental factors, and transport processes in explaining predicted contaminant loads, and (c) provide a statistical basis for estimating stream loads in unmonitored locations.
The model estimates contaminant fluxes (or "mass," which is the product of concentration and streamflow), and yields in streams (mass of nutrients entering a stream per acre of land), and evaluates the contributions of selected contaminant sources and watershed properties that control transport throughout large river networks. It empirically estimates the origin and fate of contaminants in streams and receiving bodies, and quantifies uncertainties in these estimates based on coefficient error and unexplained variability in the observed data.
The SPARROW model builds on actual stream monitoring by using spatially comprehensive geospatial data in a calibrated SPARROW model to predict water-quality conditions at unmonitored stream locations. For example, geospatial data sets can be used to describe the sources of nutrients, such as fertilizer and manure applications, atmospheric deposition to the land surface and urban sources, and factors influencing their land-to-water delivery, such as soil types and climatic conditions. The model predictions are illustrated through detailed maps that provide information about contaminant loadings and source contributions at multiple scales for specific stream reaches, basins, or other geographic areas.
SPARROW methods and selected results for watersheds across the U.S. are presented by Smith and others, 1997, in Water Resources Research Journal.
Theory, documentation, and user application of SPARROW can be found in the online USGS methods report, The SPARROW Surface Water-Quality Model: Theory, Application and User Documentation by G.E. Schwarz, A.B. Hoos, R.B. Alexander, and R.A. Smith.
How are these model results different from the previous Mississippi River Basin SPARROW model results? |Back to Top|
The previous SPARROW results were based on models, reported in Alexander and others (2008), of nutrient yields for 1992 and 2002 for ~25,000 stream reaches in the Mississippi/Atchafalaya River Basin. The statistical analyses and results in Robertson and others (2009) are based on these previous SPARROW models and predictions, but summarized for each of the eight-digit Hydrologic Unit Code (HUC8) watersheds in the Mississippi/Atchafalaya River Basin. However, Robertson and others goes further to develop a statistical procedure for identifying "high priority" areas for management, based on a probabilistic ranking of the SPARROW predictions of the delivered nutrient yield from watersheds throughout the Basin. The procedure incorporates statistical uncertainties in the previous 2002 SPARROW predictions of nutrient yields, using the methods described in question #5.
Why incorporate model uncertainty in rankings of watersheds with the highest nutrient yields delivered to the Gulf of Mexico? |Back to Top|
One management approach to reduce the hypoxic zone in the Gulf of Mexico is to target nutrient reductions toward watersheds with the highest nutrient yields delivered to the Gulf of Mexico. Various types of watershed models can be used to predict yields over large geographical areas, and it is a straight forward process to use the output from these models to rank or prioritize management efforts. However, all watershed models have uncertainty in their predictions.
Most conventional watershed modeling approaches (e.g., mechanistic models) do not consider uncertainties in the predictions of nutrient yields and their downstream delivery. The use of statistical parameter estimation procedures in the hybrid statistical/mechanistic watershed model SPARROW allows uncertainties in these predictions to be reliably estimated.
Using a statistical procedure that incorporates prediction uncertainties, Robertson and others (2009) estimate the probability that each of the 818 eight-digit Hydrologic Unit Code (HUC8) watersheds in the Mississippi/Atchafalaya River Basin are among the "top" 150 watersheds with the highest nutrient yields delivered to the Gulf of Mexico. Note that the "top 150" was selected to illustrate the statistical methodology in the study; the ranking procedure can be applied to any user-selected number of watersheds.
Robertson and others (2009) found that only 11 watersheds are likely to be included among the top 150 watersheds for nitrogen based on a 90% level of statistical confidence. However, 513 watersheds can be reliably removed from consideration as there is less than a 10% probability that these watersheds are likely to be among the top 150 contributors.
The number of watersheds that are likely to be included or not included among the top 150 watersheds will increase as the level of statistical confidence is reduced. For example, by lowering the confidence level from 90% to 75%, 61 of the 818 watersheds in the Mississippi Basin are likely to be included among the top 150 watersheds with the highest nitrogen delivery to the Gulf. In addition, 600 of the 818 are likely to not be included among the top 150 watersheds.
Results from this ranking procedure provide information on watershed nutrient yields that can benefit management efforts to reduce nutrient loadings to the Gulf of Mexico. Results are also reported by Robertson and others that can benefit local management efforts on receiving streams and reservoirs, based on a ranking of SPARROW predictions of the incremental nutrient yields, which reflect delivery only to local waters.
What causes uncertainty in SPARROW models? |Back to Top|
All models, including SPARROW, are imperfect representations of reality and therefore have uncertainty associated with them. There are many reasons for that uncertainty including: 1) limitations in the supporting stream monitoring and geospatial data; 2) limitations in the understanding of the environmental processes affecting water quality; and 3) limitations of the modeling approach in representing the environmental processes accurately. It is difficult to precisely quantify the amount of uncertainty related to the latter two items. However, uncertainty caused by limitations in the underlying data sets is understood and is being continually improved.
One important cause of uncertainty is the limitation in the number of monitoring sites available for model calibration. As in any statistical model, uncertainty in SPARROW models decreases as the number of sites available for calibration increases. In the case of SPARROW, the number of calibration sites is defined by the number of sites with sufficient water quality and discharge data for calculating a constituent load. Historically, the number of sites represented in Federal, State and local agency monitoring programs has vacillated. However, recently the number of sites with sufficient monitoring data has begun to decline. Such declines should be expected to cause greater uncertainty in all environmental models, including SPARROW.
Uncertainty in SPARROW models is also determined by the quality of the geospatial data available for building explanatory variable data. Many of the data sets from which important variables are derived are only available at a relatively coarse scale, such as for counties. To develop predictor data from such data sets, the values must be distributed to the smaller scale of stream reach drainages. This results in predictor data that have spatial uncertainty, although that uncertainty is generally reflected in the model errors through the calibration process.
How is uncertainty accounted for in SPARROW models? |Back to Top|
Uncertainty is always present in environmental models such as SPARROW. Uncertainty can be caused by many factors, but it is often related to limitations in the quantity and quality of the supporting data sets. These limitations are unavoidable because of the magnitude of the effort and the lack of resources available to support more extensive data base development. For example, water-quality measurements cannot be collected at all times at the monitored stream locations. Thus, there are intrinsic measurement uncertainties in describing stream water-quality loads from the monitoring data that are used to calibrate the SPARROW model.
Like all statistical models, SPARROW models are developed through a calibration process in which parameter values are estimated to minimize uncertainty in predicting stream constituent loads. This is achieved through a statistical algorithm called non-linear least squares in which parameter values are estimated to minimize the squared difference between the measured and predicted loads. Uncertainty is quantified as the residual error in load prediction that cannot be accounted for through parameter adjustment. The overall uncertainty in the model is quantified through a number of statistical diagnostics. However, the most common measure of uncertainty is referred to as the "mean square error" which is simply the average of the squared differences between the measured and estimated loads.
What years and watershed sizes do these SPARROW estimates of nutrient yields apply? |Back to Top|
In general, the SPARROW model predictions of nutrient sources and loads reflect long-term mean annual nutrient conditions in streams. A statistical procedure is used to ensure that the model predictions reflect long-term hydrologic and water-quality variability during a consistent time period, which produces robust model predictions of nutrient sources and transport processes. The model predictions of the mean annual load for the calibrated model were standardized to the 1992 base year to give an estimate of the mean nutrient load that would have occurred in streams in 1992 if mean annual flow conditions from 1975-2000 had prevailed. The use of nutrient measurements from 1975-1995 and flow records for 1975-2000 in the statistical load estimation procedure ensures that the nutrients loads are representative of long-term water-quality and hydrologic variability.
Alexander and others (2008) used the calibrated SPARROW models to estimate loads and yields from reaches throughout the Mississippi/Atchafalaya River Basin for circa 1992 and circa 2002. The simulated yields for 2002 account for changes from 1992 to 2002 in agricultural sources (biological N2 fixation in crops, farm fertilizer use, and crop harvesting); however, changes from 1992 to 1997 are used for animal manure nutrients and from 1990 to 2000 are used for population. The coefficients of the calibrated 1992 model were unchanged for 2002 simulations; steady-state conditions were also assumed based on long-term average streamflow over the 1975–2000 period. Robertson and others (2009) apply the mean annual nutrient loads simulated by Alexander and others (2008) for 2002 conditions to estimate the probability that a watershed is within the top 150 delivering the highest yields to the Gulf.
The 818 HUC eight digit watersheds used to rank nutrient yields in the Mississippi River Basin are generally large watersheds, ranging in drainage size from a few hundred square kilometers (km2) to 15,000 km2 (e.g., equivalent to the size of the District of Columbia to somewhat larger than the state of Maryland, respectively). Approximately 90 percent of the HUC watersheds have sizes between 1,900 to 6,500 km2 and 50 percent have sizes between 2,400 and 4,800 km2 (median=3,400 km2).
The watershed I live in is listed as "Not in the Top 150 watersheds" having the highest delivered yields to the Gulf of Mexico…does this mean there is no reason to manage nutrients in this watershed? |Back to Top|
Second, nutrient loadings from watersheds that are not included in the top 150 category may still be of concern locally because of their effects on the enrichment of nearby streams and reservoirs. Such an example is illustrated in Robertson and others (2009) for watersheds in Tennessee. These findings highlight the complexity of nutrient management issues because of the need to consider both the local scale effects and those in distant coastal areas that can be hundreds of miles downstream from a nutrient source. SPARROW results indicate that a diversity of management approaches may be needed to reduce nutrient loadings to local streams and reservoirs as well as to the Gulf of Mexico.
Which types of yields are most applicable for evaluating the watershed contribution of nutrients to a reservoir? Which types of yields are most applicable for evaluating the watershed contribution of nutrients delivered to the Gulf of Mexico? |Back to Top|
SPARROW models are developed using mass balance constraints to quantify the relation between stream constituent load (the mass of the constituent being transported by the stream) and the sources and losses of mass in watersheds. Thus, the models are inherently designed to predict load (mass per time) for all stream reaches in the modeling region. However, the predictions of stream load can be modified to provide a variety of water-quality metrics that can support various types of assessments.
SPARROW models provide predictions of "incremental", and "delivered" yields, based on corresponding measures of load. These measures provide management-relevant information about the sources and fate of contaminants for a range of spatial scales. "Incremental" yield (contaminant mass per unit of drainage area) is an estimate of the yield from each stream drainage independent from the contaminant load originating from upstream. The word "incremental" is used to describe these estimates because each is accumulated with progression downstream. Evaluating the contributions of individual (incremental) stream reach drainages helps to determine the location of the largest source areas of contaminants. Incremental yields provide valuable information on nutrient sources and conditions in local streams and reservoirs.
SPARROW model estimates of "delivered" yields can be used to evaluate the source and amount of nutrients originating from upstream watersheds that are transported to the Gulf of Mexico. Delivered yields are also computed on an incremental basis. A delivered incremental yield is adjusted for the amount of contaminant loss that occurs due to natural attenuation processes within streams and reservoirs that affect the transport to downstream receiving waters. For example, part of the nitrogen discharged to a stream in Ohio by a sewage treatment plant will be lost during transit to the Gulf of Mexico due to natural attenuation processes such as denitrification in streams or deposition in reservoirs. Using results from SPARROW models, the delivered incremental yields can be calculated for all stream reaches in a large drainage or as in Robertson and others (2009) for the 818 eight-digit Hydrologic Unit Code (HUC8) watersheds in the Mississippi/Atchafalaya River Basin and that provides a means of identifying the largest contributing areas for such a receiving water body.
How can these rankings and the associated uncertainty be used by stakeholders in the Mississippi/Atchafalaya River Basin? |Back to Top|
To achieve the nutrient standards under consideration for rivers, streams, lakes and reservoirs, and to meet the goal for a reduced size of the hypoxic zone in the Gulf of Mexico, nutrient loading from the upstream watersheds will need to be reduced. Although reducing nutrient loadings from all watersheds throughout the MARB would provide a comprehensive way to achieve these goals, it would not be the most efficient strategy because not all watersheds contribute equal quantities of nutrients to local streams and downstream coastal waters, including the Gulf of Mexico (e.g., Alexander and others, 2008). Ranking the areas contributing the largest proportion of the total load and concentrating management action in these areas is one potential nutrient management approach. This approach has merit because unit-area nutrient export (expressed as kg/km2/yr) from watersheds vary by up to several orders of magnitude among streams across the U.S. (Alexander and others, 2008).
Probabilistic ranking of delivered incremental nutrient yields from specific watersheds (see question #8) can assist water managers, policy makers, and scientists in identifying watersheds that may be the primary contributors of nutrients to the Gulf of Mexico. For instance, model findings (Robertson and others, 2009) show that 61 of the 818 watersheds in the Mississippi Basin are likely (with 75% certainty) to be among the top 150 watersheds with the highest nitrogen delivery to the Gulf of Mexico. In addition, 600 of the 818 watersheds are likely (with 75% certainty) to not be among the top 150 watersheds.
The results from this ranking procedure, based on the delivered incremental nutrient yield metric, provide information on watershed nutrients that can benefit management efforts to reduce nutrient loadings to the Gulf of Mexico. However, this metric may not address local nutrient management needs to protect nearby streams and reservoirs. These local needs may be better served by ranking the SPARROW predictions of incremental nutrient yields, which reflect delivery only to inland streams and reservoirs. Robertson and others (2009) illustrate the use of this metric to assess nutrients in Tennessee and the implications for the management of streams and reservoirs in this area.
Is more than one management approach needed to control nutrient delivery to the Gulf? |Back to Top|
Model findings highlight the complexity of the nutrient issue (see Alexander and others, 2008), and therefore point to a diversity of management approaches that may be needed to reduce nutrient loadings to the Mississippi/Atchafalaya Rivers and Gulf of Mexico hypoxia, including:
Recognition and management of different agricultural production systems and land uses contributing nitrogen and phosphorus to Gulf waters;
Recognition of the contribution from both nonpoint sources and point sources;
Control of both nitrogen and phosphorus delivery;
Consideration of reservoirs and their role on phosphorus delivery; and,
Recognition of the role of atmospheric contributions of nitrogen.
How do these findings relate to the Gulf of Mexico Hypoxia Task Force Action Plan? |Back to Top|
Activities as called for in the Action Plan are high profile for many Federal, State, and regional partners related to nutrient management and protection of the Gulf of Mexico. The findings in Robertson and others (2009) are directly relevant to the joint Federal-State Gulf Hypoxia Task Force, and the activities described in the recent 2008 Action Plan for reducing hypoxia in the Northern Gulf of Mexico. The original Action Plan, issued in 2001, set a coastal goal of reducing the 5-year running average aerial size of the hypoxia zone to less than 5,000 square kilometers by 2015. The current 5-year average size of the hypoxic zone is 14,644 square kilometers, almost three times the size of the goal. The Task Force is evaluating recommendations by EPA's Science Advisory Board to set reduction targets of at least 45 percent for both nitrogen and phosphorus in an effort to shrink the size of the hypoxic zone and meet the goal for 2015. States and EPA may, therefore, need to adopt a dual nutrient management strategy in order to reduce the size of the hypoxic zone (2008 Action Plan).
Where can I get additional related information? |Back to Top|
Theory, documentation, and user application of SPARROW can be found in the online USGS methods report, The SPARROW Surface Water-Quality Model: Theory, Application and User Documentation by G.E. Schwarz, A.B. Hoos, R.B. Alexander, and R.A. Smith
Mississippi River Gulf of Mexico Watershed Nutrient Task Force
EPA Science Advisory Board (SAB) recommendations, (333 p., 4.74 MB)
Reassessing Hypoxia Forecasts for the Gulf of Mexico, by Donald Scavia and Kristina A. Donnelly, Environ. Sci. Technol.; 2007; 41(23) pp 8111 – 8117
NOAA information on hypoxia in the Gulf of Mexico and nutrients in the Mississippi Basin
What are the contributions of urban sources to the nutrients delivered to the Gulf? |Back to Top|
Urban sources are described in the SPARROW model on the basis of human population from the U.S. Census. Population may reflect the combined contributions of nutrients from various urban and suburban sources, including wastewater treatment effluent discharges, septic systems, runoff from suburban lawns (e.g., non-farm fertilizers), and local atmospheric nitrogen deposition (especially emissions from automobiles).
Although urban nutrient sources can have a significant effect on local water quality, these sources generally contribute a much smaller percentage of the nutrients to the Gulf of Mexico than non-urban nonpoint sources, especially agricultural sources. For example, in comparision to all nutrient sources (see source shares), the model estimates indicate that urban sources of nutrients in all HUC watersheds in the Mississippi River Basin contribute only about 9 percent of the nitrogen load delivered to the Gulf and about 12 percent of the delivered load of phosphorus.
Moreover, urban sources are major contributors of phosphorus in fewer than 20 of the 818 HUC watersheds in the Mississippi River Basin (i.e., within these HUCs, urban sources represent more than 50 percent of the share of the HUC load delivered to the Gulf); in addition, fewer than 11 of these HUC watersheds are among the "top 150" contributing watersheds to the Gulf. Collectively, these 20 HUC watersheds contribute less than 5 percent of the total phophorus load from all sources delivered to the Gulf. For total nitrogen, urban sources are a major contributor (i.e., more than 50 percent of the HUC share of the delivered load) in fewer than 18 of the 818 HUC watersheds in the Basin; only 7 of these HUC watersheds are among the "top 150" contributing watersheds to the Gulf. Collectively, these 18 HUC watersheds contribute less than 2 percent of the total nitrogen load from all sources delivered to the Gulf.

![]() U.S. Department of the Interior | U.S. Geological Survey
U.S. Department of the Interior | U.S. Geological Survey
URL: http://water.usgs.gov/nawqa/sparrow/nutrient_yields/faq.html
Page Contact Information: gs-w_nawqa_whq@usgs.gov
Page Last Modified: Tuesday, 04-Mar-2014 14:45:13 EST
