National Water-Quality Assessment (NAWQA) Project
BACK TO Nutrient Delivery to the Gulf of Mexico Materials Page
1. What is SPARROW? |Back to Top|
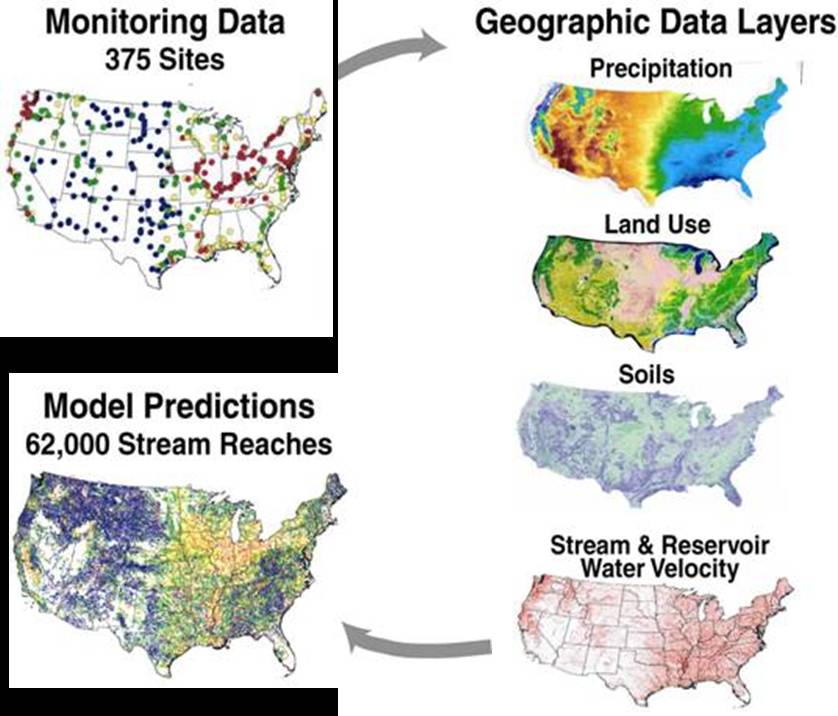
The newly released USGS study represents an enhanced geo-statistical analysis of the Mississippi River and Atchafalaya River Basins using the SPARROW (SPAtially Referenced Regressions On Watershed attributes) model. SPARROW is a watershed modeling technique for relating water-quality measurements made at a network of monitoring stations to attributes of the watersheds containing the stations, land-to-water delivery rates, and in-stream processing rates. The core of the model consists of a nonlinear regression equation describing the non-conservative transport of contaminants from point and non-point (or “diffuse”) sources on land to rivers and through the stream and river network.
The model estimates contaminant concentrations, fluxes (or “mass,” which is the product of concentration and streamflow), and yields in streams (mass of nutrients entering a stream per acre of land), and evaluates the contributions of selected contaminant sources and watershed properties that control transport over large spatial scales. It empirically estimates the origin and fate of contaminants in streams and receiving bodies, and quantifies uncertainties in these estimates based on coefficient error and unexplained variability in the observed data.
The SPARROW model builds on actual monitoring through wall-to-wall geospatial information, such as on fertilizer and manure applications, atmospheric deposition to the land surface and urban sources. Predictions and analytical results are therefore illustrated through detailed maps that provide information about nutrient loadings at multiple scales for specific basins or geographic areas, even in unmonitored areas.
SPARROW methods and selected results for watersheds across the U.S. are presented by Smith et al, 1997, in Water Resources Research Journal.
Theory, documentation, and user application of SPARROW can be found in the online USGS methods report, The SPARROW Surface Water-Quality Model: Theory, Application and User Documentation by G.E. Schwarz, A.B. Hoos, R.B. Alexander, and R.A. Smith.
2. Does the study evaluate trends in stream nutrient loads? |Back to Top|
No. The study is not intended to evaluate trends in actual stream nutrient loads or determine whether nutrient conditions are getting worse or better. Rather, the study is focused on improving understanding of the major nutrient sources, including land uses and human
activities, that contribute nitrogen and phosphorus to the northern Gulf of
Mexico; to quantify the hydrologic and biogeochemical controls on the transport
of nitrogen and phosphorus in watersheds; and, to describe the watershed properties that explain spatial variability in long-term average flow and nutrient conditions in streams.
The authors’ analysis does, however, provide some limited trend information about the potential response of mean annual nutrient loads in streams to changes in nutrient sources from 1992-2002 (see question #10 for additional details). The authors used the SPARROW model to estimate changes in mean-annual stream nutrient loads from 1992 to 2002 in response to changes in nutrient sources over this decade, assuming that the mean-annual flow conditions and the model coefficients were unchanged (see question #3 under the section “Geographic Variations in Nutrient Delivery”). The authors conducted this assessment to evaluate whether the nutrient loads and source shares, as reported in Table 2 of the ES&T article for the 1992 base year model, were applicable 10 years later, following changes in the nutrient sources (see questions #8 and #9 for a discussion of the 1992 base-year model calibration). The findings indicated changes of less than 10 percent in the source shares from 1992 to 2002 for the major sub-basins. The net result at the outlet of the Mississippi River Basin was that mean-annual nitrogen flux in 2002 was less than 5 percent lower in 2002 than modeled mean-annual loads for the 1992 base year, whereas the mean annual phosphorus load was less than 1 percent. Thus, the authors concluded that estimates of source contributions to the Gulf as reported for the 1992 base-year model (Table 2) are generally robust to changes in the nutrient sources from 1992-2002.
The authors also used the 2002 model simulations to estimate the flow-independent change from 1992-2002 at the outlets of seven regional drainages (Table 2 in the ES&T article) to provide some ground truth for the model-based predictions of change over that period. The authors found general agreement in the model-simulated and monitoring-based estimates at 5 of the 7 sites for phosphorus and 3 of the 7 sites for nitrogen. Agreement was closest at the outlets of the Ohio and Central Mississippi regions and the Lower Mississippi at St Francisville, locations with drainages that contribute the largest quantities of nutrients to the Gulf. Comparisons between model- and monitoring-based estimates are complex and can be confounded by temporal lags in nutrient transport that can extend over multiple years.
Information on trends in nitrogen and phosphorus loads through 2005 at the outlet of the Mississippi River Basin was recently reported by the EPA Science Advisory Board (SAB) in their report and recommendations on Gulf of Mexico Hypoxia issues, 333 p., 4.74 MB
3. How is this model different than previous SPARROW modeling in the Mississippi River Basin? |Back to Top|
SPARROW has been used for a variety of applications and estimates of nutrient yields, sources, and transport in river basins across the U.S.. A full listing is available online and includes, for example an article in Nature in 2000 of the Effect of stream channel size on the delivery of nitrogen to the Gulf of Mexico and an article in Water Resources Research in 1997 on a Regional interpretation of water-quality monitoring data.
This most recent study uses an enhanced SPARROW model that assesses sources and processes that influence the transport of total nitrogen and total phosphorus in the Mississippi and Atchafalaya River Basins and their delivery to the Gulf. The development of separate models of nitrogen and phosphorus, with similar stream monitoring data for calibration, enables comparisons among these nutrients that advance understanding of the geography and types of sources and transport processes that control their delivery to the Gulf.
Model advances also include enhanced reach-scale flux-accounting methods that support nonlinear in-stream and reservoir nutrient decay functions; an updated spatial infrastructure, based on 30-m land use and 1-km digital topography; and new data on climatic conditions, cropping and artificial-drainage systems, and animal manure nutrients. As a result, the current model includes a larger number of nutrient sources (10 for nitrogen and 8 for phosphorus) as compared to 5 that were in SPARROW models in the past. In addition, the model contains approximately 25,000 sub-catchments (median size about 60 square kilometers), which are delineated from the 1-km digital elevation models. The sub-catchments are part of a detailed stream reach network, defined by topography, streams, and reservoirs at a 1:500,000 scale. The resulting model has higher prediction accuracy and greater complexity with improved interpretability of nutrient sources and transport processes in comparison to prior SPARROW models. Specifically, the model prediction errors are 20 percent lower than those reported for prior SPARROW models after accounting for differences in the calibration stations.
4. What sources of nutrients are simulated in the model? |Back to Top|
Ten nutrient sources (8 for total phosphorus) are incorporated, including atmospheric deposition of nitrogen, urban sources, and nutrients in runoff and subsurface flow from agricultural and other lands. Agricultural sources are separated into cultivated croplands and pasture/rangelands. Croplands include nutrient inputs from biological nitrogen-fixation (soybeans, alfalfa, and hay), commercial fertilizer use on seven major crops, and animal manure that is recovered from confined animals on nearby farms and applied to crops as fertilizer. Pasture/rangelands include nutrients from non-recoverable animal manure, which is manure from unconfined animals and manure lost during the collection, storage, and treatment of wastes from confined animals, including concentrated animal feeding operations. To the extent that seasonally applied fertilizers to grazed pastures are spatially correlated with animal populations, these inputs would be included in the pasture/rangeland source, but are likely to be small relative to manure nutrients.
5. What landscape properties are used in the model to estimate nutrient delivery to streams? |Back to Top|
The model estimates nutrient delivery to streams in subsurface and overland flow (“land-to-water” delivery) in relation to climate, soils, topography, drainage density, and artificial drainage. First-order decay functions for streams and reservoirs are used to describe transport.
6. How many monitoring stations are used to calibrate the model? |Back to Top|
The model estimates are calibrated to the long-term mean annual load of total nitrogen and phosphorus at 425 long-term
stream monitoring stations. Each station has a minimum of 30 nutrient observations for nitrogen and
phosphorus and daily streamflow data.
7. Why does the study examine loads? |Back to Top|
Although the SPARROW model predicts both loads and concentrations in streams, this study focuses on an interpretation of the model predictions of nutrient loads (units of kilograms per year) in streams and the loads delivered to the Gulf of Mexico from watersheds in the Mississippi and Atachafalaya River Basins. The study also reports the “delivered yield”, which is the nutrient mass per unit of drainage area that is delivered to the Gulf (units of kilograms per km2 per year). Information on loads and yields is needed to understand how human sources and natural processes affect the supply and transport of nutrients in watersheds and nutrient delivery to receiving waters such as the Gulf, where excessive nutrients cause eutrophication and hypoxia. This information is critical for managing nutrient reductions in contaminant sources and their effects on the chemical and biological integrity of downstream aquatic ecosystems. Load is also referred to as a “mass flux”, which is the concentration of a compound in water multiplied by the water volume or streamflow. Concentrations are most useful for understanding the suitability of water for use by aquatic organisms and humans (e.g., water contact, drinking water supplies), and depend critically upon the volume of water flowing in streams. Contaminant concentrations in streams are subject to regulation by the
EPA and the States. Other USGS studies have interpreted nutrient concentrations and trends in streams of the United States; see, for example, http://pubs.usgs.gov/fs/fs11803/; http://pubs.usgs.gov/sir/2006/5107/sir5107abs.html; http://aslo.org/lo/toc/vol_51/issue_1_part_2/0639.pdf.
8. How are loads calculated? |Back to Top|
The SPARROW model uses the mean annual load (mass per unit time, expressed as kilograms per year) at each of 425 stream monitoring stations to calibrate the model. The mean annual load is computed using USGS load estimation methods; for details, see the supporting information for the ES&T article and the SPARROW model documentation.
In brief, these load estimation methods combine regularly collected nutrient measurements at the monitoring stations from 1975-1995 with daily streamflow values from 1975-2000 to yield more accurate estimates of the long-term mean annual load than can be obtained by using the individual nutrient measurements alone. The mean annual nutrient load is also standardized to the base year of 1992 to give an estimate of the mean nutrient load that would have occurred in 1992 if mean annual flow conditions from 1975-2000 had prevailed. The use of standardized loads in the SPARROW model gives more robust estimates of nutrient sources and transport processes as compared to an approach based solely on using the water-quality records during any single year or short multi-year periods. The standardization procedure accounts for differences in station record lengths and sample sizes and ensures that the nutrient loads are representative of long-term hydrologic and water-quality variability. This emphasis on long-term mean conditions enhances the capability of the model to estimate the major sources and watershed processes that affect the long-term supply, transport, and fate of nutrients in watersheds. (See question #9 for an explanation of why 1992 was used as the model base year.)
9. To what years do the SPARROW model predictions apply? |Back to Top|
In general, the SPARROW model predictions of nutrient sources and loads reflect long-term mean annual nutrient conditions in streams. A statistical procedure is used (see question #8) to ensure that the model predictions reflect long-term hydrologic and water-quality variability during a consistent time period, which produces robust model predictions of nutrient sources and transport processes. The model predictions of the mean annual load for the calibrated model are standardized to the 1992 base year to give an estimate of the mean nutrient load that would have occurred in streams in 1992 if mean annual flow conditions from 1975-2000 had prevailed. (Note that the mean annual nutrient loads were simulated for 2002 to evaluate the robustness of the model predictions to changes in nutrient sources from 1992-2002; see question #10 for details). The use of nutrient measurements from 1975-1995 and flow records for 1975-2000 in the statistical load estimation procedure ensures that the nutrients loads are representative of long-term water-quality and hydrologic variability.
The base year 1992 was chosen to ensure consistency with other ancillary data used in the model, including nutrient-source data, land use, climate, stream networks, etc. Land-cover data (USGS National Land Cover Data or NLCD) are only available for 1992; these are complemented by agricultural statistics on animal nutrients and crop land area and production, which are only reported every 5 years. County based estimates of the nutrient content in animal manure, from the U.S. Department of Agriculture (USDA), were available through 1997. The stream water-quality data are only available through 1995 when the vast majority of sites were discontinued; few other Federal monitoring sites provide contemporaneous streamflow and water-quality monitoring records for as lengthy a time period (i.e., nearly two decades).
10. Does the model estimate mean annual loads for years other than the 1992 base year? |Back to Top|
The SPARROW model was used to simulate stream nitrogen and phosphorus load for 2002, based on changes in the model inputs of major nutrient sources from 1992-2002, to evaluate the robustness of the nutrient source shares, as reported in Table 2 of the article, to these decadal changes in sources. These model simulations assume that the model parameters, mean streamflow, and model errors are unchanged over time. Loads predicted for 2002 (versus those modeled for the 1992 base year) reflect updated information (or changes) in population and agricultural sources (animal manure, biological nitrogen fixation in crops, farm fertilizers use, and crop harvesting). Therefore, estimates in flux in 2002 only reflect changes in nutrient sources and are independent of the actual changes in streamflow from 1992 to 2002. In addition, the 2002 simulations do not include the effects of any changes in farm management practices unrelated to crop fertilizer use and production or animal populations (e.g., addition of buffer strips).
The purpose of the 2002 simulation was to answer the question “How much would the mean annual stream nutrient loads and source shares be expected to change in response to changes in nutrient sources from 1992-2002, assuming no changes in mean flow and model coefficients.” The analysis indicated that the decadal changes in stream flux and source shares were typically less than 10%. Thus, the authors concluded that the estimates of source contributions to the Gulf for the 1992 base-year model (as reported in Table 2 of the article) are generally robust to changes in the nutrient sources from 1992-2002.
11. Were model simulations for 2002 calibrated to on-the-ground data? |Back to Top|
No. A new model calibration was not conducted for 2002, in large part, because of the lack of continuity in water-quality monitoring records (reduced from about 425 in 1992 to about 35 in 2002). However, the authors used the 2002 model simulations to estimate a flow-adjusted change in mean annual nutrient load from 1992-2002 at the outlets of seven regional drainages to provide some ground truth for the model predictions during that period. The authors found general agreement in the model-simulated and monitoring-based estimates at 5 of the 7 sites for phosphorus and 3 of the 7 sites for nitrogen. Agreement was closest at the outlets of the Ohio and Central Mississippi regions and the Lower Mississippi at St Francisville, locations with drainages that contribute the largest quantities of nutrients to the Gulf.
The USGS is currently updating the ES&T study to examine data from more recent time periods in the 2000s. This entails the compilation of State monitoring data to expand the number of stations available for model calibration. Additional spatial data are also being compiled, including agricultural sources (e.g., manure, from the National Resources Inventory, or NRI) and land-cover data (2002 Multi-Resolution Land Cover data or MRLC), which were not available for evaluation in the ES&T study.
12. How do natural changes in stream flow affect the model spatial estimates? |Back to Top|
Actual nutrient-transport measurements show large year-to-year variations, driven largely by year-to-year variations in weather and flow conditions across the Basin. For example, USGS long-term monitoring of water quality and streamflow show that the amount of nitrogen increased since the late 1960s; and that the amount was low during the drought in the late 1980s but high during the flood of 1993, even though the amount of nitrogen applied to fields in the basin was not significantly different (http://ks.water.usgs.gov/Kansas/pubs/fact-sheets/fs.135-00.html ). In addition, year-to-year variations in the mean-annual nitrogen load can range over as much as two orders of magnitude at the monitoring stations evaluated in the ES&T study, although the annual variations more typically range from 20-40 percent of the long-term mean annual load.
Year-to-year variations, such as these, and within-year variations in nutrients and streamflow are accounted for in a step prior to SPARROW spatial modeling (see question #8 for details). This prior step is critical to obtain stream nutrient loads for calibrating the SPARROW model that are representative of the long-term mean hydrologic and water-quality conditions at each monitoring station. SPARROW has the objective of explaining spatial differences in nutrient loads that are related to the intrinsic factors that control the mean rates of nutrient supply and transport, rather than the factors that explain more extreme hydrologic conditions during any particular year or years at a location. The SPARROW predictions of mean nutrient load include the effects of spatial variations in mean climatic (precipitation, temperature) and streamflow conditions. This emphasis on long-term mean conditions enhances the capability of the spatial model to estimate the major contaminant sources, including land uses and human activities, and natural processes that affect the long-term supply, transport, and fate of nutrients in watersheds.
1. Do agricultural and urban sources contribute similar quantities
of nutrients to the Gulf? |Back to Top|
No, however, agricultural sources in the watersheds contribute more
than 70 percent of the delivered nitrogen and phosphorus, versus
only about 9 to 12 percent from urban sources. Such findings show the dominance of
nonpoint sources outside urban areas in the
Mississippi
River Basin
and
Gulf of Mexico.
2. Are the agricultural sources that contribute nutrients to the Gulf the same for nitrogen and phosphorus? |Back to Top|
Modeled findings reveal important differences
in the agricultural sources for nitrogen and phosphorus. The findings
help fill important gaps in information on sources of phosphorus in the
Mississippi
River Basin
at a time when recognition is expanding that phosphorus is an important
contributor to Gulf hypoxia. The joint federal-state Gulf of Mexico Hypoxia
Task Force is evaluating recommendations by EPA's Science Advisory Board to
set reduction targets of at least 45 percent for both nitrogen and phosphorus
in an effort to shrink the size of the "hypoxic zone" to 5000
square-kilometers by 2015. The current 5-year average size of the hypoxic zone
is 14,644 square kilometers, almost three times the size of the goal. States
and EPA may therefore need to adopt a dual nutrient management strategy in
order to reduce the size of the hypoxia zone in the Gulf.
The report shows that animal manure on pasture and range lands (referred to as non-recoverable manure) contributes nearly as much phosphorus as cultivated crops, 37 versus 43 percent. The study suggests that phosphorus associated with the wastes of unconfined animals is a much larger source of phosphorus in the Mississippi River Basin than previously recognized. Current animal manure management emphasizes controlling nutrients primarily from confined animal facilities. By contrast, the study reports that nitrogen originates primarily from cultivated crops (about 65 percent, mostly from corn and soybeans), with animal grazing and manure contributing only about 5 percent. Atmospheric deposition also is a major contributor of nitrogen (16%).
Urban (population-related) sources constitute about 9 percent of the delivered load of nitrogen to the Gulf and about 12 percent of the delivered load of phosphorus. Findings therefore show the dominance of nonpoint sources outside urban areas in the Mississippi River Basin and Gulf of Mexico.

3. Why are the USGS study findings on contributions from urban
sources substantially lower than those estimated by the EPA Science Advisory Board? |Back to Top|
Point source contributions estimated by the EPA Science Advisory Board are 22 to 34 percent (versus USGS estimates of about
9 to 12 percent). The difference is probably due, in large part, to the ability of the enhanced model to account for transformations during transport, including, for example, the capture of phosphorus in large reservoirs, particularly in the Tennessee River and Missouri River Basins. In general,
recommendations by the EPA Science Advisory Board (SAB) do not consider the effects of nutrient decay in streams and reservoirs. Thus, the SAB assumed that all nutrients that are input to streams from wastewater treatment plants in the Mississippi River Basin are delivered to the Gulf of Mexico without any loss.
In addition, the methods for computation of urban sources differed; EPA
estimates were based on discharges as reported in their database and USGS
estimates were based on population.
4. Has the contribution of animal manure to the phosphorus loads
delivered to the Gulf been previously documented? |Back to Top|
The study reports that, on average, 37% of the phosphorus load that is delivered
to the Gulf originates from non-recoverable animal manure in the Basin. The
estimate is about twice as large as previously estimated for the Mississippi
River Basin in the 1999 Gulf of Mexico Hypoxia Assessment (Goolsby
et al., 1999). This USGS study defines non-recoverable animal manure as the
manure that is not recoverable for use as fertilizer on cropland. This includes
manure from unconfined animals and manure lost during the collection, storage,
and treatment of wastes from confined animals, including concentrated animal
feeding operations. Non-recoverable manure is primarily associated with pasture
and rangelands.
The large contribution of animal manure to stream phosphorus loads and the general findings of differences in the agricultural sources of nitrogen and phosphorus are explained, in large part, by differences in the supply and transport properties of nitrogen and phosphorus (described in more detail in the ES&T article). These include the enrichment of phosphorus relative to nitrogen in excreted animal waste and, as estimated by the model, in the runoff to streams. The finding that phosphorus delivery to streams from animal manure is higher than from cultivated crops is potentially explained by the use of conservation and reduced tillage practices on many row crops, which are frequently more effective at removing phosphorus than nitrogen; by enhanced phosphorus runoff from animal compaction of soil surfaces in intensely grazed pastures; and, direct animal contact with the streams.
It is of note that surprisingly little research has assessed the effects of different agricultural production systems on the relative contributions of phosphorus and nitrogen in runoff and streams, especially across varied agricultural environments. More spatially detailed modeling that includes stream monitoring data from small catchments with diverse agricultural land uses is needed to improve understanding of the explanatory factors.
1. Do contributions vary by State or sub-basin? |Back to Top|
Relative contributions of nitrogen and phosphorus delivered to the Gulf from each of the 31 States in the Mississippi River Basin vary and are provided in the Supporting Information (http://pubs3.acs.org/acs/journals/supporting_information.page?in_manuscript=es0716103). Nine of 31 States, including Illinois, Iowa, Indiana, Missouri, Arkansas, Kentucky, Tennessee, Ohio, and Mississippi (ranked in order of contribution), contribute the largest amounts of nutrients to the Gulf (>75 percent of the nitrogen and phosphorus), but comprise only one-third of the drainage area.
These States are associated with the largest acreage of corn
and soybeans (85% of the nitrogen), and the largest amounts
of non-recoverable animal manure, primarily from pasture
land (70% of the phosphorus). Graphic below shows state
shares of the total nutrient mass to the Gulf of Mexico.
In large part, the top nine States drain the eastern half of the Mississippi River Basin, including in the Central Mississippi and Ohio River Basins. These two sub-regions have the highest delivered nutrient yields (mass of nutrients delivered to the Gulf per acre of land area) and contribute nearly 60 percent of the nitrogen to the Gulf (mostly associated with corn/soybean cultivation), and 54% of the phosphorus (primarily associated with pastureland and corn/soybean cultivation).

Overall, the model suggests when considering the effects of the stream network on nutrient transport (independent of other factors, such as soils), it would be most efficient to control nutrient delivery to the Gulf from the sources in watersheds drained by large rivers, which are associated with low rates of natural nutrient removal. For example, the removal of one pound of nitrogen from larger rivers would cause a similar reduction in nitrogen delivered to the Gulf of Mexico. By contrast, removal of 2 to 3 pounds of nitrogen would be required in smaller rivers and streams with higher natural rates of nitrogen loss to achieve a one-pound reduction in nitrogen delivery to the Gulf.
Reservoirs play a very significant role in reducing the downstream movement of phosphorus. The fraction of phosphorus load in streams that is delivered to the Gulf is, on average, 50 percent lower than that for nitrogen (representing all 8 major sub-basins). The difference can be explained, in large part, by different transport/removal mechanisms. Phosphorus generally adheres to sediment, which is retained in reservoirs, whereas nitrogen is more soluble and readily moves downstream with stream flow, subject to losses from denitrification. Local- and regional-scale reductions in phosphorus delivery to the Gulf are particularly evident in the Tennessee Basin and parts of the upper, central, and western regions of the Mississippi drainage where many large reservoirs are located.
3. Do spatial patterns differ in model simulations for 1992 and 2002? |Back to Top|
Overall, relatively small differences, typically <10%, were found in the model predictions of the mean nutrient loads for 1992 and 2002 at the outlets of the major regions in the Basin, with generally similar spatial patterns evident in the estimates of the percentage change in nitrogen and phosphorus loads from 1992-2002.
As background, model predictions were made of the mean annual nutrient load for the year 2002, assuming that mean streamflow and the model parameters and errors are constant over time. The loads estimated in 2002 (versus those modeled in 1992) reflect updated information (or changes) in population and agricultural sources (animal manure, biological nitrogen fixation in crops, farm fertilizers use, and crop harvesting). The purpose of the 2002 simulation was to answer the question “How much would the mean annual stream nutrient loads and source shares be expected to change in response to changes in nutrient sources from 1992-2002, assuming no changes in mean flow and model coefficients.” The analysis indicated that the decadal changes in stream flux and source shares were typically less than 10%. Thus, the authors concluded that the estimates of source contributions to the Gulf for the 1992 base-year model (as reported in Table 2 of the article) are generally robust to changes in the nutrient sources from 1992-2002.
The authors found that the estimated changes in the simulated stream nitrogen and phosphorus loads from 1992-2002, although relatively small, show generally similar spatial patterns. Decreases in simulated stream nitrogen fluxes were noted in the upper Mississippi and Ohio River Basins, caused primarily by reductions in commercial fertilizer inputs of nitrogen to crops, coincident with the large expansion of soybean land areas in most regions (10-60 percent increase) and increases in harvested nitrogen (the change in harvested nitrogen was about 10 percent of the total inputs to corn/soybeans in 2002). Net nitrogen inputs to corn and soybeans fell by 8 to 14 percent in the Ohio and Upper Mississippi regions.
Increases in simulated stream nitrogen and phosphorus fluxes were noted in the Missouri and Arkansas regions, caused primarily by increased commercial fertilizer use related to expanding corn and soybean land area (net inputs increased by 18 to 30 percent for nitrogen and 35 to 60 percent for phosphorus); increases in animal manure production (4 to 10 percent) contributed to the increases in stream phosphorus fluxes. Decreases in animal manure production in the Ohio and the Upper and Central Mississippi (8 to 19 percent) contributed to decreases in stream phosphorus fluxes in the former two regions; flux from the latter regions was offset by slight increases in phosphorus fertilizer use on corn and soybeans. The decreases in animal populations in these regions reflect a general pattern that began in the 1980s.
In addition, model findings can be used to identify geographic areas, such as by sub-basins and States, where it would be most cost effective to implement such strategies, and to test and fine tune the possible effectiveness of different nutrient management options for nutrient reduction.
2. Is more than one management approach needed to control nutrient delivery to the Gulf? |Back to Top|
Model findings highlight the complexity of the nutrient issue, and therefore point to a diversity of management approaches that may be needed to reduce the nutrient burden flowing into the Mississippi River and causing hypoxia in the Gulf of Mexico, including:
3. How do findings relate to the Gulf of Mexico Hypoxia Task Force Action Plan? |Back to Top|
This effort is high profile for many Federal, State, and regional partners and their decision making related to nutrient management and protection of the Gulf. Findings are directly relevant to the
joint federal-state Gulf Hypoxia Task Force, which is revising their Action Plan for Reducing, Mitigating, and Controlling Hypoxia in the Northern Gulf of Mexico (expected in February 2008). The original Action Plan, issued in 2001, had set a coastal goal of reducing the 5-year running average aerial size of the hypoxia zone to less than 5,000 square kilometers by 2015.
The current 5-year average size of the hypoxic zone is 14,644 square kilometers,
almost three times the size of the goal. The Task Force is evaluating
recommendations by EPA's Science Advisory Board to set reduction targets of at
least 45 percent for both nitrogen and phosphorus in an effort to shrink the
size of the hypoxic zone and meet the goal for 2015. States and EPA may
therefore need to adopt a dual nutrient management strategy in order to reduce
the size of the hypoxic zone in the Gulf
(http://www.epa.gov/msbasin/taskforce/pdf/2008draft_actionplan.pdf 31 pp, 558k).
4. How do findings relate to recommendations by the EPA Science Advisory Board? |Back to Top|
The original estimates of nitrogen reductions needed to meet this goal were 30 percent, but EPA’s Scientific Advisory Board has recommended in its report that a dual nutrient strategy of at least 45 percent reductions of both nitrogen and phosphorus may be needed to reach the coastal
goal (read about SAB
recommendations, 333 p., 4.74 MB).
5. What are the implications for modeling and monitoring? |Back to Top|
Development of hydrologic and water-quality models has come a long way, and has resulted in improved broad-based assessments of conditions, as well as of key factors and processes that affect water quality, such as nutrients—including land use, chemical sources of contamination, natural landscape features, and hydrologic transport.
Success of the SPARROW model approach depends on: 1) accurate and spatially detailed information about the watershed including information about cropping patterns, urban populations, point source discharges, and manure use; 2) spatially extensive long-term water-quality data, coupled with streamflow data; and 3) continuing research and application of models that explicitly consider land and water processes and the way that they determine the downstream movement of pollutants.
Successful management of the Gulf Hypoxia problem demands continued attention to all three of these ingredients so that progress can be tracked and strategies can be improved over time based on the most up-to-date data and understanding of the system.
Unfortunately, a number of stream locations monitored by the Federal and State agencies (where data are suitable for this kind of analysis and are readily available in digital form) has declined remarkably. For example, during 1975-1980, when monitoring was at its peak, the number of locations in the U.S. where the USGS collected nutrient data suitable for use in studies such as the SPARROW model or for long-term trend analysis was about 4,500. In contrast, the number we have today is only about 1,900 stations, a decline of about 60 percent.
USGS stations used in this SPARROW analysis for the 1992-model-calibration totaled 425 stations (from the NASQAN Program). Available USGS stations declined to 35 stations in 2002.
In addition to water-quality monitoring, much of the spatial ancillary data needed to interpret the water-quality data are lacking, including better information on point source discharges, use of chemicals, land-use changes, water use, land-management practices, conservation efforts, geomorphology and stream networks, and geologic settings.
We must continue to integrate long-term, on-the-ground monitoring with predictive tools to assure relevant representation of the physical, chemical, and biological processes in the models, coupled with powerful statistical techniques to estimate the importance of various factors used in the models. Continued monitoring and data collection will reduce the overall uncertainty of model predictions and estimates. In turn, uncertainly analyses associated with each prediction will help to guide future monitoring and data-collection needs.
We face data limitations regarding ancillary information needed for model support, including that for point sources, agricultural applications and practices, and changes in land-management practices (including, for example, on best management and conservation efforts).
6. Where can I get related information? |Back to Top|
1. What are future plans for SPARROW modeling? |Back to Top|
This study lays the ground work for ongoing USGS efforts with EPA in the Mississippi River Basin
to identify
priority watersheds in the Mississippi River Basin contributing nutrients to the northern part of the Gulf of Mexico (anticipated USGS approval end of FY08).
In addition, USGS is developing more refined (or detailed) SPARROW models in 4 sub-basins of the Mississippi River Basin through the NAWQA Program (including the Southeast; Great Lakes, Ohio, and Upper Mississippi; Missouri; and the Texas Gulf and Lower Mississippi). The more detailed models will include a greater number of monitoring sites (such as collected by the States) to the modeling framework; more detailed and up-to-date spatial information, such as for land use; and reduced model error. The models are anticipated in 2009.
2. How can SPARROW be applied to better understand future cropping patterns, such as increased corn production for biofuels?
|Back to Top|

![]() U.S. Department of the Interior | U.S. Geological Survey
U.S. Department of the Interior | U.S. Geological Survey
URL: http://water.usgs.gov/nawqa/sparrow/gulf_findings/faq.html
Page Contact Information: gs-w_nawqa_whq@usgs.gov
Page Last Modified: Tuesday, 04-Mar-2014 14:45:03 EST
