USGS Flood Inundation Mapping Science
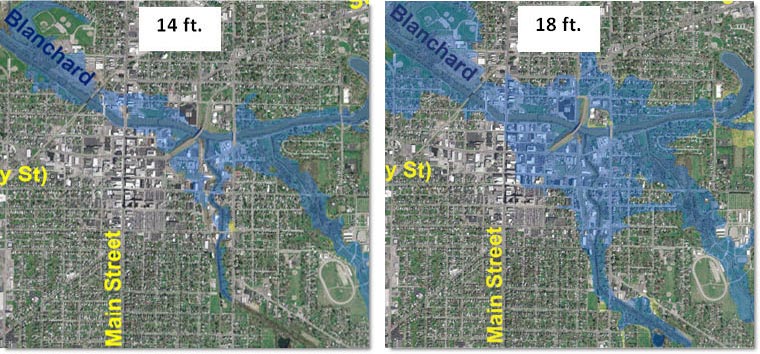
Static flood-inundation map libraries consist of maps that have been created in advance of a flood that are ready to be served through the Internet- each library consists of a set of flood extent and depth maps developed for predetermined stream stage intervals (for example, a map for each one foot of stage). A user can view real-time or forecast stage data from a USGS streamgage or National Weather Service flood forecast point and quickly access the map corresponding to the stage data.
 Example of hydrograph (gage height plotted over time) for a flood at the USGS streamgage Blanchard River near Findlay, Ohio illustrating how data from a USGS streamgage can be linked to inundation map libraries. At National Weather Service flood forecast points, forecast stages hours to days in advance can be used to estimate inundated areas hours to days in advance.

![]() U.S. Department of the Interior |
U.S. Geological Survey
U.S. Department of the Interior |
U.S. Geological Survey
URL: http://water.usgs.gov/osw/flood_inundation/focus-staticmap.html
Page Contact Information: Marie Peppler
Page Last Modified: Tuesday, 25-Feb-2014 09:11:53 EST
