USGS Flood Inundation Mapping Science
Following major flooding, USGS personnel and partner agencies set high-water marks that record the peak water level of the flooding. Inundation maps that depict the extent and depth of the flooding can be generated from the high-water mark elevations.

Example of a mud line high-water mark used to create inundation maps in Wisconsin following major flooding in June, 2008.

A USGS scientist sets a marker in a telephone pole at the elevation of a high-water mark. USGS crews will use survey equipment to determine the elevation of the marker to create inundation maps.
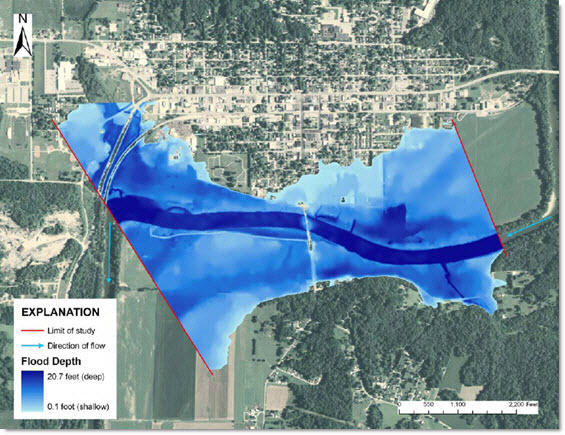
Example of an inundation map for flooding of June, 2008 developed from high-water mark elevations for the White River at Spencer, Indiana. USGS scientists created the map by using high-water mark elevations to determine the peak height of the flood water over the ground. The elevation of the land surface was determined from computer data files of terrain elevations called Digital Elevation Models.

![]() U.S. Department of the Interior |
U.S. Geological Survey
U.S. Department of the Interior |
U.S. Geological Survey
URL: http://water.usgs.gov/osw/flood_inundation/focus-docs.html
Page Contact Information: Marie Peppler
Page Last Modified: Tuesday, 25-Feb-2014 09:11:53 EST
