Water Use in the United States
WATER USE
|
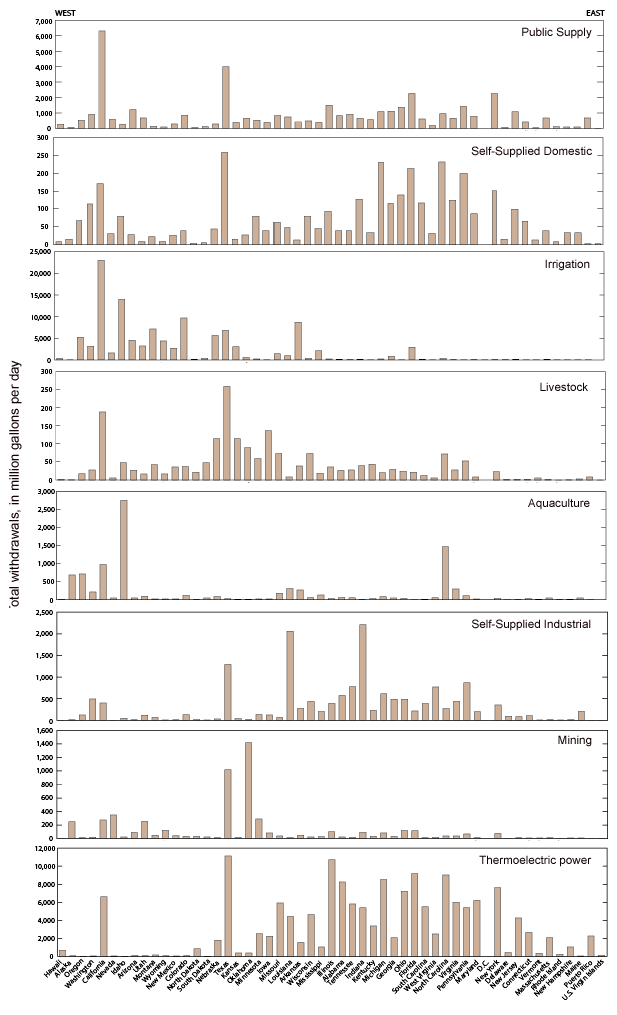
Geographic distribution of water use by category(Source for graphs: Maupin, M.A., Kenny, J.F., Hutson, S.S., Lovelace, J.K., Barber, N.L., and Linsey, K.S., 2014, Estimated use of water in the United States in 2010: U.S. Geological Survey Circular 1405, 56 p., https://pubs.usgs.gov/circ/1405/.)
In these bar graphs the States are ordered geographically from west to east. The magnitude of the withdrawals cannot be compared here as the scales of the graphs are not the same, but the different geographic distributions of categories of water use can be examined. Irrigation withdrawals are predominantly in Western States to the left of the graphs. Thermoelectric power is larger in the Midwest and Eastern States. Higher withdrawals for California (fifth bar from the left) are apparent on the public supply, domestic, irrigation, livestock, aquaculture and thermoelectric power graphs. Texas, another State with large withdrawals in a number of categories, is to the left of center and is prominent on the public supply, self-supplied domestic, livestock, self-supplied industrial, mining, and thermoelectric power graphs. |


