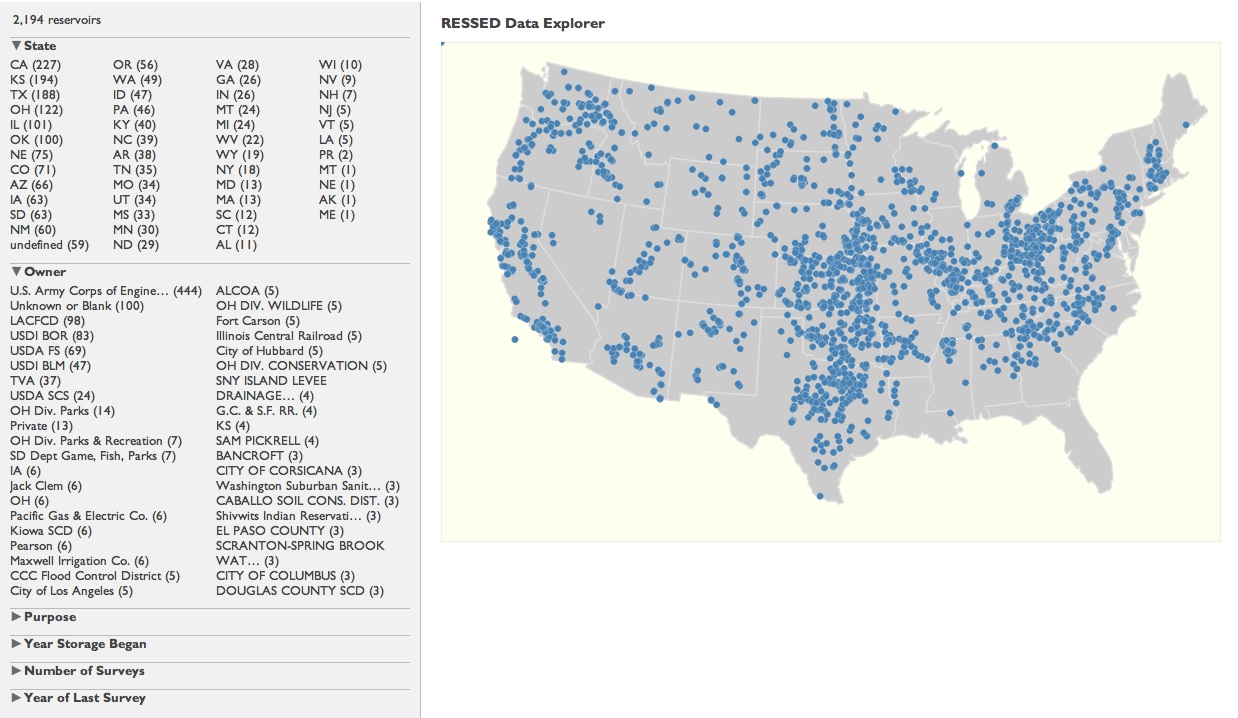
RESSED Data Explorer
The RESSED Data Explorer Application is a demonstration web application provided by the RESSED development team to enable potential users of the database to gain some insight into the structure of the data without the need to access RESSED output files external to this website. This feature was developed based on the understanding that the full database in Filemaker Pro format will not be publically available in FY2013, and that some users may not be able to easily query the XML- and JSON-format RESSED output files available through the Data Download and Documentation option on this website. This application depends on, and is limited to, information contained in the RESSED application.
While still a demonstration prototype, the Explorer packs some useful features into its small (<500 lines of combined HTML, JavaScript, and CSS) codebase, including:
- A zoomable location map for reservoirs,
- The frequency of numbers of those reservoirs matching a variety of user-selectable attributes,
- The ability to filter the selected set of those reservoirs, and
- A chart showing capacity changes based on each survey over the period of record for a selected reservoir.
Because the Data Explorer application uses features such as Scalable Vector Graphics (SVG) and class-based selection techniques requiring HTML version 5 and Cascading Style Sheets version 3, a Class-A browser such as Chrome, Firefox, Internet Explorer 9+, Safari, or Opera is required utilize the application.
Data Source
The Data Explorer application uses an export of the RESSED database in JavaScript Object Notation (JSON) as its data source. Once downloaded, the application does all of its searching and filtering against this local “database,” without needing to go back to the server. The RESSED JSON file is structured similarly to the master RESSED database, and users are encouraged to open up the file in an appropriate text editor to examine its structure (an export of the RESSED database in XML format is also available. It is larger and much more comprehensive than its JSON companion file. We ran a script against the XML file to generate the JSON version).
Navigating the Explorer Interface
 When the Data Explorer application starts the user should see a panel on the left and the map on
the right (please be patient; it can take several seconds for the database to download). Once this
finishes, the program will look through the data, slice and dice the values, and mark the location
of all of the reservoirs as blue dots on the map.
The left panel is divided into the six sections listed below, each of which can be opened or closed
by clicking on the triangle symbol next to the section name. Each section (or facet) slices the
reservoir data along a particular dimension, grouping and counting the results. The parenthesized
value following each group name contains the number of reservoirs within that group. The
groups are sorted by count value in decreasing order. Not all reservoirs have data for every facet,
so the counts will not necessarily match the total number of reservoirs.
- State—Groups by 2-letter state alpha code.
- Owner—Groups by reservoir owner.
- Purpose—Groups by how the reservoir is used. Reservoirs may have more than one purpose. (Note: currently only Corps of Engineers reservoirs have the purpose section filled in.
- Year Storage Began—Groups by decade the year water storage began at each reservoir.
- Number of Surveys—Groups by the (recorded) number of surveys performed at each reservoir.
- Year of Last Survey—Groups by decade the year in which the last survey was recorded.
Using the faceted search selection filter
When the application starts, the State and Owner sections are opened as a convenience for the user. Click on a group in any of the sections and it will be highlighted in blue, automatically adding it to a selection list. The other facets will adjust based on each selection and reservoirs that don't match the selection will be removed from the map. You can click on multiple groups to add them to the selection. De-selecting all groups from a facet is essentially the same as selecting all of them, except for the reservoirs that don't have a value for that facet. You can start adding groups to the selection from any facet, but try and select all the groups in which you interested before moving to another facet. Once you start selecting from a second facet, you may not be able to add groups to the first facet until you deselect everything from it.
Investigating further with the location map
The location map can be panned and zoomed. Use a click-and-drag operation to move the map around. Use your mouse wheel to zoom in or out. (Pinch and spread works on multi-touch devices.) Hover over a reservoir location dot and a small window appears with the ID, name, and owner of the reservoir. Click on the reservoir and the details appear below the map, including a small bar graph showing the capacity history for the reservoir, if those data are available.

