Global Navigation Satellite System

|
Hurricane Storm-Surge GNSS Surveying Campaigns
High accuracy surveying takes time and planning. Surveying in an area that has been strongly affected by a hurricane takes additional planning, and on-site decision making because of unexpected hazards and situations. Some topics that need to be considered in the planning are discussed below, as well as different methods that have historically been used in hurricane storm-surge surveys. USGS publications produced from hurricane storm-surge surveying also are provided for further reference. PlanningThe primary items that need to be planned before entering a hurricane affected area and beginning a survey include personnel safety and datum control. Personnel Safety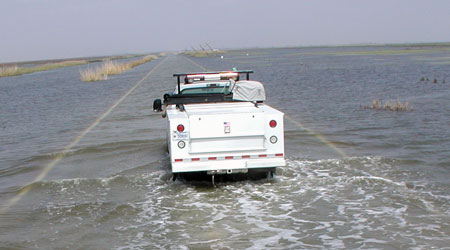
Personnel safety should be considered first when planning a surveying campaign in a hurricane hit area. If a few weeks can pass after the storm and before surveying it is best; this will allow for the area to be cleaned up of major hazards. Each surveyor will need a contact list with phone numbers for an emergency contact outside of the storm affected area and for all other surveyors. If satellite phones and/or GPS emergency tracking devices are available the project leads should take these along. When entering into storm affected areas basic necessities such as water, food, hotels or camp grounds, and fuel may not be available. Therefore, lots of drinking water, extra food, camping supplies or a trailer, and toiletries should be packed during preparations. Typically, fuel can be purchased just outside of the affected area. Even when a survey is conducted in an area that is considered safe, it is a good idea to have technical support contact information and help information along wither you have been using the equipment for 2 days or 2 years, problems are always encountered in the field that cannot be resolved without a little help. Often the people who sell the equipment will be very knowledgeable in helping to troubleshoot problems, or the standard technical support for the equipment brand can be used. Survey ControlSurvey control should be consistent throughout the survey area. National Geodetic Survey (NGS) benchmarks or NGS Continuously Operating Reference Stations (CORS) are good control since NGS maintains all benchmarks and CORS in a consistent datum and makes regular updates when necessary. In addition, location and accuracy data on NGS benchmarks and CORS are easy to obtain online. Other agency benchmarks such as the state department of roads or U.S. Army Corps of Engineers or even USGS streamgaging station marks are not recommended for use because they can be in a variety of datum and inconsistent over large areas such as those typically surveyed after large tropical storms. When using both CORS stations, CORS derived positions on newly established benchmarks, and NGS benchmarks in the survey, the current adjustment must be considered. The latest adjustment to NGS benchmarks (passive geodetic control monuments) is NAD83(2007), whereas CORS stations are NAD83(CORS96). NGS states that "positional coordinates of these two adjustments should be consistent to within the accuracy of the GPS data used in the adjustment". Even though current adjustments of CORS stations and NGS benchmarks are similar, it is best to use only one adjustment as the control, and the other adjustment can be used as a quality check. A similar issue is epoch dates listed for NGS benchmark coordinates. Epoch dates are the GPS time for when the benchmark position was computed and is "valid". NGS benchmarks (passive geodetic control monuments) do not have velocities computed for them like CORS; therefore, the epoch is given for when the current position was calculated, and because of crustal movement, the true location of the benchmark may vary slightly. In areas where crustal movement is common, a surveyor should pay close attention to these dates and select their control from benchmarks with the most current coordinates. Continuously Operating Reference Station (CORS) Availability
Before surveying in a storm region, the availability and quality of CORS data can be checked through the NGS home page at http://www.ngs.noaa.gov/CORS/. NGS provided diagrams showing station movement with time; these are referred to as time series diagrams and can be found under downloads and standard downloads from the CORS homepage listed above. If movement was seen during the storm, that particular CORS station may not be usable. If the station was damaged and currently is not operating, NGS will show this in their data availability information given at the same location as the time series data. Station quality is more important than distance; however, longer baselines will require more data to resolve, meaning longer static sessions. After evaluating the quality and availability of surrounding CORS stations, the surveyor can select which stations to use or specify which stations not to use when processing data through OPUS by going into the options tab before final submission of data through OPUS static or rapid-static. Quality (Order), Spatial Distribution (Availability), and Stability of ControlBefore traveling to the affected area it is best to locate high order (horizontal A, B, or 1 and vertical 1 or 2) NGS benchmarks in the survey area. These can be located by conducting a radial search on the NGS datasheets web site. Another resource providing many updated station recovery images and descriptions can be found within the geocaching community at http://www.geocaching.com/mark/. Benchmarks located can be selected and their datasheets can be downloaded to a text document. This document should be distributed to all surveyors so that the necessary benchmarks can be located in the field. After saving the datasheet, a shapefile containing PIDs and location information also should be downloaded for the same benchmarks using the shapefile tab on the NGS datasheets site. Some types of data collection software can easily import this data so that all surveyors have the information right at hand which eliminates incorrect naming and helps with benchmark location. Quality of Modeled Geoid for Orthometric ConversionHurricanes occur in coastal areas where land changes commonly occur; therefore, existing benchmarks (even NGS benchmarks) and geoid models may not be up to date and may have a significant amount of error associated with them. When surveying in such an area it is beneficial to talk with NGS personnel for the most updated information in that area. Setting Benchmarks and Reference MarksEven with a good list of available high order NGS benchmarks in the storm affected area many of these benchmarks maybe unusable because of the mark being underwater, covered with unmovable debris, not located because of loss of reference objects, or found but no longer stable or in the correct location. Therefore, each surveyor should be prepared to set their own permanent and temporary benchmarks. Temporary marks include asphalt nails, chiseled X’s, surveyors nails with washers, or rebar with a point chiseled into the middle. More permanent marks can be USGS brass caps that are stamped survey mark and set into concrete (either existing or new) or surveyors can purchase their own caps and stakes through companies that specialize in supplying survey markers. Even when benchmarks are available, reference marks (RM) will need to be set at each storm-surge sensor or streamgaging station; these RMs can be temporary marks as explained above. Navigation and Data ManagementThe shapefile of NGS benchmarks and other control in the area, as well as study site locations (storm-surge sensors and streamflow gages) should be included in a real-time mapping software so surveyors can navigate to these areas even when roads, signs, landmarks, and sometimes even roads are missing. Most handheld GPS units can upload points, but are often small and hard to see. Streets and trips is one program that can run on a laptop and connect to a handheld GPS device for real-time navigation. Whatever works for each surveyor is fine, as long as everyone has a good map with control and study site locations on it. In addition to the location information and the text document with NGS datasheets, each surveyor should have a word document that describes the location of the storm-surge gages so that reference marks can be established in a location that allows future leveling to the sensor. If possible, a pre-deployment meeting should be arranged to distribute this information and discuss logistics such as file naming conventions, surveying methods (RTK vs. Static), data downloads (who will be responsible at the end of the day to organized all the survey data collected and back it up), and the initial surveying plan (which should be flexible because many unexpected circumstances arise with this type of surveying). Historic Campaign ParticipantsThe following are those who helped with the GPS surveying following each hurricane. Those who established storm-surge sensors, processed the storm-surge sensor data, and brought GPS elevations to the storm-surge sensor location using traditional leveling are not included in this listing. Please contact Brenda Woodward with updates to this part of the Web page since it is currently incomplete. Hurricane Rita (September 23, 2005): Static and RTK GPS surveying methods used Wade Kress, Brenda Woodward, Paul Rydlund, Chris Rowden, Joe Beauchamp, Chris Braun, Marcus Gary, Robin Gary, and Joseph Vrabel Hurricane Wilma (October 24, 2005): Elevation established through optical leveling and static GPS Hurricane Gustav (September 1, 2008): RTK GPS surveying methods used Jason Payne, Marshall Preas, John Storm, Kenneth Wilson, and William Baldwin Hurricane Ike (September 13, 2008): Static and RTK GPS surveying methods used Jason Payne, John B. Storm, Marshall Preas, Brenda Woodward, Justin Krahulik, Roger Haschemeyer, Chris Braun, Kenneth Wilson, and William Baldwin Hurricane Irene (August 20, 2011): Static, single-base RTK, RTN Russ Lotspeich, Brent Banks, Shaun Wicklein, Joel Guyer, Nate Beberdick, Amanda Hodges, Brian Pointer, Bryce McClenney, Chad Wagner Hurricane Isaac (August 28, 2012): Static, single-base RTK,RTN Tony Gotvald, Trent Baldwin, John Storm, Van Wilson, Ben McGee, James Fountain Hurricane Sandy (October 30, 2012): Static, single-base RTK,RTN Tony Gotvald, Chad Ostheimer, Mike Noll, Tim Brooks, Tim Lanier, Bryce McClenney, Russ Lotspeich, Brent Banks, Shaun Wicklein, Nate Beberdick, Amanda Hodges, Karl Dydak, Jim Duda, Carlos Rodriguez, David Stillwell, Eric Rudisill Surveying MethodsReal Time Kinematic (RTK)
RTK surveying requires one receiver and radio established over a known benchmark (base receiver) that transmits a correction to a second receiver (roving receiver) being used to survey other points in the field. The base receiver and the roving receiver must be tracking the same satellites for this type of carrier-phase based relative positioning to work correctly. The base station can be set by the surveyor on a known benchmark, or RTK base networks can be used with the proper licenses and equipment (see Real-Time Networks (RTN) Surveying for more info). Typically in storm affected areas there will not be a RTK base network to work in, either because of the remote location or damage done to the networks base stations; therefore, the surveyor likely will have to set up their own base stations. The surveyor can set up multiple base stations at the beginning of the day if a large area is going to be surveyed by setting each base to transmit over a slightly different radio frequency (or same frequency with different radio id). If the distance to be surveyed in one day requires the base to be moved several times, the crew may want to designate one truck and one person to be responsible for setting up and moving the base stations. The rover typically can survey positions 5 to 10 miles away from the base station, depending on the terrain, the type of transmitting radio and antenna, and the use of signal repeaters. RTK base networks transmit data using cell phones; therefore, signal can be received for long distances (however should be limited to 10 km). The farther the surveyor is from the base, the greater the relative error is between the known position and the newly surveyed position. These accuracy specifications typically are provided in the equipments manual. Once the base is established either by the surveyor or through a RTK base network, GPS rovers are used to survey in the elevation of a permanent or temporary reference mark near the storm-surge sensors. In rare cases the actual elevation of the sensor can be surveyed, but most of the time elevation is established at a nearby reference mark and optical leveling is used to transfer the elevation to the actual sensor location. A modified RTK technique has been used in most storm-surge sensor surveys to reduce the baseline lengths between the rover and base station and allow for a more centralized base-station location. This technique is similar to a set of differential levels because the base station is set over a point of unknown coordinates. Instead of inputting its location, the base station is set with an approximate location based on WASS corrected GPS readings and "fixed" in this position. All rover measurements are then made relative to the fixed base station with measurements on control points considered backsights, and measurements on unknown points (storm-surge sensors) considered foresights. This technique allows the selection of the best location possible for the base station without the requirement to set up over a known benchmark that could have obstruction or stability issues, or long base lines. Whereas the base station runs continuously, each rover occupies a location (either a control point or a storm-surge sensor) for a minimum of 3 minutes (180 epochs at a 1-second logging interval) to compute a final elevation. The rover is then inverted until communication with the satellites and the base station is lost. To ensure quality in the data, the rover is then allowed to reinitialize and a second fixed solution is determined over the original point. This is done because the GPS solution occasionally is in error (known as an integer ambiguity error), and a second measurement can be compared to the first to ensure that the error is not affecting the reading. If the maximum allowable difference of 0.02 meter between the first and second solutions is not met, the same procedures for re-initialization are followed, and a third measurement is made. Quality-control parameters such as vertical precision (generally within 0.03 meter), position-solution standard deviation root mean square (0.01 m), and PDOP (Position Dilution of Precision < 3) are checked to indicate whether or not a solution should be removed because of poor quality; if not, all solutions are kept for a final average. To ensure quality in the data, as many control points as possible should be included with each base-station setup. Four control points surrounding the survey area are considered ideal, but in some cases only one is available. At each base-station setup, the RTK-derived elevations at the control points are compared to the published NGS elevations (National Geodetic Survey, 2009) and the difference is applied to the RTK-derived elevation for each unknown RM. If the differences between the NGS-published elevations and RTK-derived elevations based on the WAAS starting position for the base receiver are not consistent among all the control points, an average difference or if possible a root mean square error adjustment value should be computed and applied to the RTK-derived elevation at each unknown RM. Generally, horizontal positions are not corrected based on known locations; instead the average of the RTK positions based on the WAAS starting position for the base receiver is used since precise elevation is required, not position. Generally, the difference in elevation between control point RTK positions and NGS published elevations were close within a single base setup. The problem with RTK surveying is the need to locate known high order benchmarks in close proximity to each study site, which can take lots of time and is extremely difficult in storm affected and often remote areas. Static GPS surveying is another option for establishing elevations at storm surge-sensor locations. Static
Static surveys ideally consist of three or more GPS receivers recording data at 15-second intervals over known benchmarks (NGS benchmark, reestablished benchmark, or newly established benchmark) that form a triangle (no greater than 64 kilometers on each side) around several sensor sites. While all three base stations are collecting data, GPS receivers are set over reference marks at sensors enclosed within the triangle formed by the benchmarks to record GPS data at 15-second intervals for 2 to 6 hours. All collected GPS data are then post-processed to relate base-station correction information to the data collected at sensor RMs through baseline processing and network adjustment. When collecting static GPS data for post-processing with a network adjustment, data collection efforts must be mapped out and designed so that several independent baselines can be processed from the three base stations to the reference marks being surveyed. In simple terms, an independent base line is the first two sides of a triangle, the third side is dependent on the other two sides. If three NGS benchmarks are not available within a reasonable distance(60 miles), control points may need to be established through multiple full day OPUS sessions on a newly set benchmark. In addition, several benchmarks should be included in the adjustment that are not used as control, but as checks. These often can be CORS, but if the CORS are not close, they will have greater error than the typical RM because of the long baseline, and may not provide an adequate check of quality at the RMs. During surveying, each surveyor should take sufficient notes on the antenna used and the height of the antenna. It is suggested to use fixed height tripods (usually 2meters) so that measurement error is eliminated from the instrument setup. Processing static GPS survey data can be done in several software packages including Trimble Business Center. Completing a successful network adjustment, especially if the network is large ( >40 miles) can take time and requires a thorough knowledge of the software, its quality descriptor, and the steps that need to be followed. If a surveyor does not typically conduct static surveys, it would be beneficial for them to contact either a dealer or another surveyor who regularly processes static surveys for advice on setting up the survey, collecting the field data, and processing help to ensure quality results. The first step in processing static GPS data is to bring all the raw data files into the software package and assign the right antenna types, heights, and consistent names. Rinex data for each of the CORS stations can be downloaded from the NGS CORS website. After all raw data have been loaded into the project, baselines are processed to determine the exact x,y,z difference between each pair of observations and all three-sided loops are evaluated to determine whether or not errors in loop closures can be reduced by identifying and removing inconsistent baselines or duplicate baselines that conflicted with one another. Once all loops close within acceptable standards—typically loops can be closed vertically within 0.05 meter and horizontally within 0.04 meter—a minimally constrained adjustment is processed. The minimally constrained adjustment is completed with just one control point held constant (fixed). Before adjusting, all known control points (CORS and NGS benchmarks) are set by entering their known positions and elevations into the project, but not holding these positions fixed. This allows the surveyor to evaluate the adjustment by reviewing how far each known point has been shifted. During the minimally constrained adjustment, error estimates are scaled to better identify the error in baseline processing. The minimally constrained adjustment also helps to identify any data outliers that do not fit within the overall network. After the minimally constrained adjustment is made and evaluated, several known control points are fixed, a Geoid model is applied, and a fully constrained adjustment is made. Quality checks such as shifts in elevation and position applied to non-fixed control points, 95-percent confidence limits in the accuracy of measurements of each position, and parts per million (PPM) errors in baselines are evaluated. The PPM error is a calculation of error based on the length of the baseline. The largest shift in elevation of a non-fixed control point is a good evaluation of vertical accuracy within the network. Some software packages do not adequately calculate errors in orthometric heights so error can be estimated by adding the average error in the Geoid model (0.020 meter for Geoid03) to the estimated error in ellipsoid heights. If errors are acceptable, then the position and elevation calculated by the fully constrained adjustment can be accepted as the final position and elevation of each survey point. A final quality check that can be made is the processing of all raw data collected through OPUS. If multiple observations were completed on one survey point the surveyor can compare positions calculated from several different control points (CORS through OPUS and NGS benchmarks through a post processing software) and with several different satellite geometries. Multiple observations also allow the surveyor more opportunities to find and eliminate poor quality data and yield a more reliable position. Though static surveying takes time, it often is the only option in areas where benchmarks are greater than 15 miles from study sites. With some planning, good data organization, and some processing time, a large network can be adjusted to give good and consistent positions (within 5 cm) and elevations (within 8 cm) at each of the study sites. Traditional: LevelingTraditional levels can be run from high order NGS benchmarks to storm-sensor sites. However, the distance from the benchmark to the site typically is great enough that this method takes a substantial amount of time. If in some instances high order NGS benchmarks are close to study sites, traditional surveying could prove to be a faster and more accurate method of bringing a consistent elevation to each of the sites. Levels generally are run so that closure error is not greater than 0.03 m. In addition, optical leveling can be used to quality check GPS data by running levels between two points that have been surveyed in using GPS and comparing the elevation differences from GPS and leveling. Data SubmissionFinal position information or vertical position information is used by the USGS to level in elevations of the storm-surge sensors. The storm-surge sensor elevation is used to adjust the height of the water above the sensor into elevation. With all storm-surge data being related to a consistent elevation datum, the storm surge can be mapped across the storm affected area. Permanent benchmarks that were re-established or newly installed should be documented in a benchmark database either locally or through OPUS-DB. NGS benchmarks that were located and used should be reported to NGS through the benchmark recovery website. USGS PublicationsPayne, J.D., Woodward, B.K., and Storm, J.B., 2009, Global Positioning System surveys of storm-surge sensors deployed during Hurricane Ike, Seadrift, Texas, to Lake Charles, Louisiana, 2008: U.S. Geological Survey Data Series 435, 17 p. McGee, B.D., Goree, B.B., Tollett, R.W., Woodward, B.K., and Kress, W.H., 2006, Hurricane Rita surge data, Southwestern Louisiana and Southeastern Texas, September to November 2005: U.S. Geological Survey Data Series 220. Soderqvist, L.E., and Byrne, M.J., 2007, Monitoring the storm tide of Hurricane Wilma in Southwestern Florida, October 2005: U.S. Geological Survey Data Series 294, 16 p. McGee, B.D., Tollett, R.W., and Mason, R.R. Jr., 2006, Monitoring inland storm surge and flooding from Hurricane Rita: U.S. Geological Survey Fact Sheet 2006-3136, 4 p. Preas, M.T., Payne, J.D., Goree, B.B., and Storm, J.B., 2009, Global positioning system survey of storm-surge sensors deployed during Hurricane Gustav, New Orleans, Louisiana, to Lafayette, Louisiana, 2008: U.S. Geological Survey Data Series (in review). Rydlund, P.H., Jr., and Densmore, B.K., 2012, Methods of practice and guidelines for using survey-grade global navigation satellite systems (GNSS) to establish vertical datum in the United States Geological Survey: U.S. Geological Survey Techniques and Methods, book 11, chap. D1, 102 p. with appendixes. |

![]() U.S. Department of the Interior |
U.S. Geological Survey
U.S. Department of the Interior |
U.S. Geological Survey
URL: http://water.usgs.gov/osw/gps/storm-surge.html
Page Contact Information: Contact USGS
Page Last Modified: Tuesday, 25-Feb-2014 09:07:54 EST

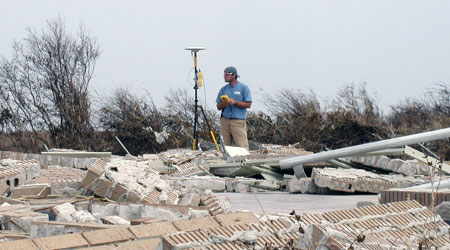 In the past several years, the UGSG offices in Louisiana, Mississippi, and Texas have used pressure transducers as temporary stage gages to map the storm surges produced by hurricanes along the coast. Before hurricanes make landfall, these USGS offices mount pressure transducers and barometers along the coast, coastal waterways, and bays to measure the height of water above the transducer throughout the storm. To model the full storm surge, all water elevation data needs to be brought into a common datum. Since storms often affect a large area of coast-line, a local datum is inadequate; therefore, GPS surveying methods have been used to accurately translate a national datum to each field site where a pressure transducer was deployed.