Global Navigation Satellite System

|
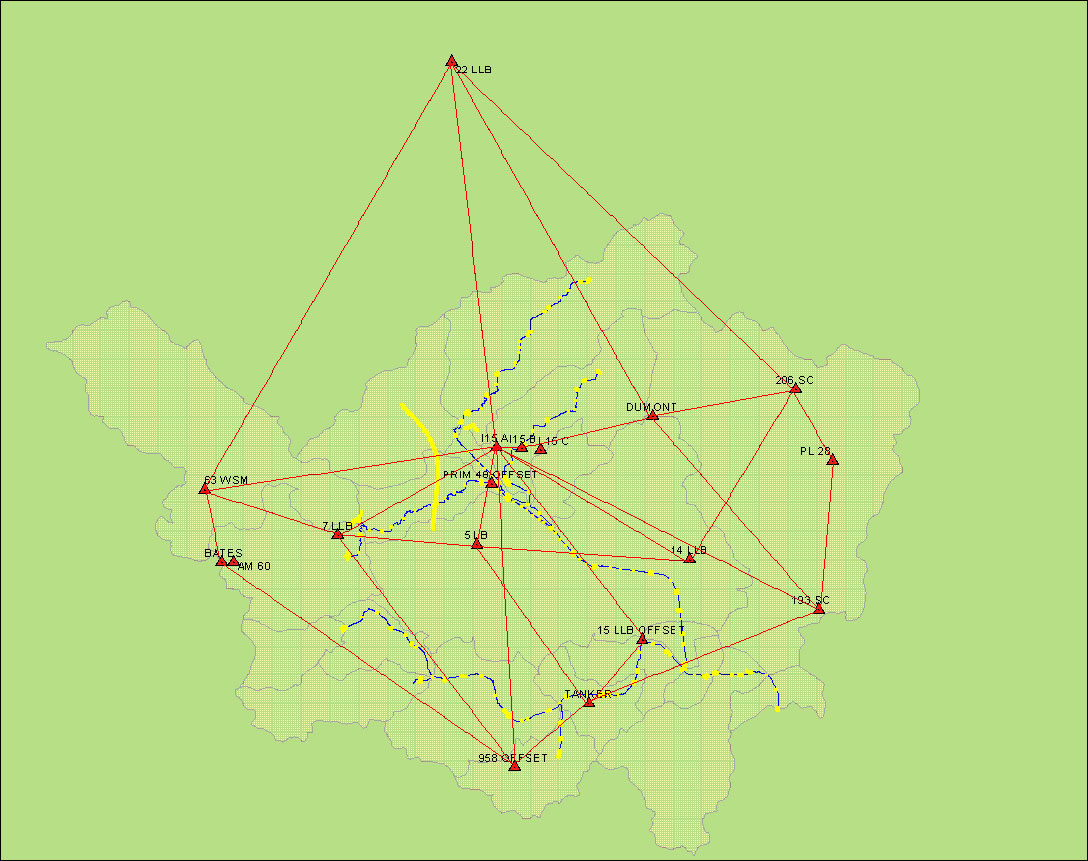
Continuing USGS Projects Involving GNSSWell field surveys – establishment of ElevationOverviewWell head elevations are required by groundwater scientists to understand, model, and document hydraulic head. Surveys of well head elevations require prior knowledge of acceptable vertical error which is dependent upon the project’s objectives. The USGS requires the elevation of wells to be reported, along with the accuracy of the elevation; however, the USGS does not require the elevation accuracy to be of a certain quality. Most historical well elevation accuracies are derived from topographic maps resulting in an elevation accuracy of one-half the contour interval of the topographic map. Greater accuracy well elevation measurements are becoming more common using GPS surveying techniques; however, these usually are directly related to the project’s requirements. ApproachThe method of elevation measurement for well heads is dependent upon project requirements which control the allowable error in elevation measurements. Hydraulic gradient typically is the factor that controls the allowable error for groundwater projects. The range of well head spatial coordinates (x, y, and z coordinates) describes the overall hydraulic gradient of the groundwater level within a study area. Elevation measurement accuracies should be much smaller than the overall range of well head elevations (the z coordinate). For example, well head elevations derived from topographic maps for a groundwater-level study in an area with a thousand foot change in hydraulic head is acceptable; however, a small well field study with an overall groundwater head change of a meter or less will require elevations derived from other survey techniques (levels, total station, GPS, etc.). Occasionally, the allowable error will be driven by associated project requirements like streamgage elevation measurements for groundwater/surface-water interaction studies, or models requirements including groundwater and surface-water components. These types of studies tend to require elevation accuracies derived from GPS surveying techniques at a minimum. UncertaintyWith the required accuracy for groundwater-level measurements ranging between 0.01 and 0.1 foot (0.3 – 3 centimeter) depending upon the depth of the well and the well’s angle of deviation, GPS elevation surveys likely will be the largest source of vertical error in a groundwater elevation measurement. So again, the choice of elevation measurement is dependent upon the accuracy requirements of each individual project, and these accuracy requirements usually are dependent upon the overall groundwater hydraulic gradient or other more stringent project requirements. ExamplesThere are several hundred potentiometric surface, depth to water, and difference maps in the USGS publications warehouse alone (more than 40 were published in 2009). Most of the newer publications utilized GPS-surveying techniques to obtain well elevations, but few, if any, have extensive documentation concerning the elevation survey. An issue with most well elevation surveys is the lack of documentation or reporting related to the survey. Most potentiometric maps published report that the wellheads were surveyed with a GPS system, with no mention of the procedures used or the precision or accuracy maintained throughout the survey. Example of topographic map well elevations used to make a depth to water map: "Depth to water in the western Snake River Plain and surrounding tributary valleys, southwestern Idaho and eastern Oregon, calculated using water levels from 1980 to 1988." Example of water table maps using GPS survey techniques: "Water-Resource Trends and Comparisons Between Partial-Development and October 2006 Hydrologic Conditions, Wood River Valley, South-Central Idaho." Example of a groundwater flow model using GPS-surveyed wells and stream gages: "Ground-Water Flow Model for the Spokane Valley-Rathdrum Prairie Aquifer, Spokane County, Washington, and Bonner and Kootenai Counties, Idaho." GPS Surveying for a Flood Insurance Study (FIS)OverviewSurveying for Flood Insurance Studies generally is broken into two parts: the carrying of control to a site and the survey of the site. All surveys must meet standards described in the Guidelines and Specifications for Flood Hazard Mapping Partners. In the recent past, total stations have been used in both capacities. Total stations were used to establish baselines from one benchmark to another. These baselines were then further expanded to establish known coordinates at various stream sites (bridges, culverts, dams, weirs, etc.). Later, users set on the control established at the stream sites and collected in-channel and structure geometry data. The effort to carry control from one benchmark to another and then to each stream site was laborious and time consuming – sometimes taking weeks. With GPS, the effort involved in the baseline part of the surveying, and in some cases the site data collection, can be substantially reduced. GPS surveying can not only result in project time and cost savings but can allow for larger project scales. As with any project, adequate control (benchmark information) is needed to ensure a consistent data set. With GPS surveying, more control can be used than typically would be used for total station surveying with little additional effort. With total station surveying different study reaches (different streams as well as different reaches on the same stream) may not be tied together because of large distances between study reaches. Each study reach may be tied to one or more independent benchmarks. With GPS surveying, all benchmarks, and as a result all study reaches, can be tied together. Relating all control points together not only provides a consistent data set, but also performs a quality control check on all benchmarks used. This eliminates errors introduced from surveying a study reach with a total station off one benchmark. ApproachTypically, GPS surveying for flood insurance studies is split into two phases. The first phase involves the establishment of a control network based upon benchmarks that, ideally, surround the study area. Control networks often involve static surveying. Through static surveys the surveyor can very accurately check the quality of the benchmarks being utilized and check or survey in any semi-permanent marks being used for reference at the study site that may be used in the second phase of GPS surveying (RTK surveying). The semi-permanent sites serve several purposes: they minimize baseline lengths to the stream sites, usually are selected in areas open to the sky and are conducive to radio broadcasts, are expected to provide an improved level of security (for unattended GPS units), and may provide access to power. The exact method of how the static control network is established is dependent on the physical arrangement of the benchmark network, the number of GPS receivers involved, the level of coordination between the GPS receivers, and the accuracy requirements of the survey. The second phase involves bringing control to the stream sites. This phase usually is carried out using RTK surveying. The base station sites for the RTK surveys are either benchmarks used in the control network or any semi-permanent sites established during the control network survey. RTK surveying allows control points (typically two to three survey nails or survey hubs) to be established at or nearby (depending on sky visibility) each stream site. Baseline lengths are minimized by moving the base station receiver from one network control point to another. In limited cases, some site data collection also may be accomplished using RTK to survey open channel cross sections instead of using a total station as described below. Depending upon availability, Real-Time Network (RTN) surveying also may be used for an FIS survey. Instead of having to develop a network of benchmarks (and in some cases establish semi-permanent base station locations) and later establish stream site control points using RTK, RTN surveying can accomplish both tasks at the same time. As always, standard survey practices should be followed: stay within the RTN, check accuracy of field-survey results against control points (benchmarks) that surround the work area(s), perform in-field calibration of survey job if necessary, and take redundant, independent readings of a selected number of survey points. Accuracy typically is in the range of and in some cases can exceed that of traditional RTK surveying. Data collection at stream sites typically is conducted using a total station since stream sites usually are located in the riparian corridors. Data collection at stream structures can involve working in close proximity to and/or under the structure (in the case of a bridge). All of these factors limit visibility to the sky making GPS surveying difficult. In addition, stream depth may require the use of a boat. ExamplesTwo example cases are given showing different project scales and an additional example is given using a RTN. Project scales can range from a single stream reach to a county-wide effort involving multiple streams. Large Scale Project
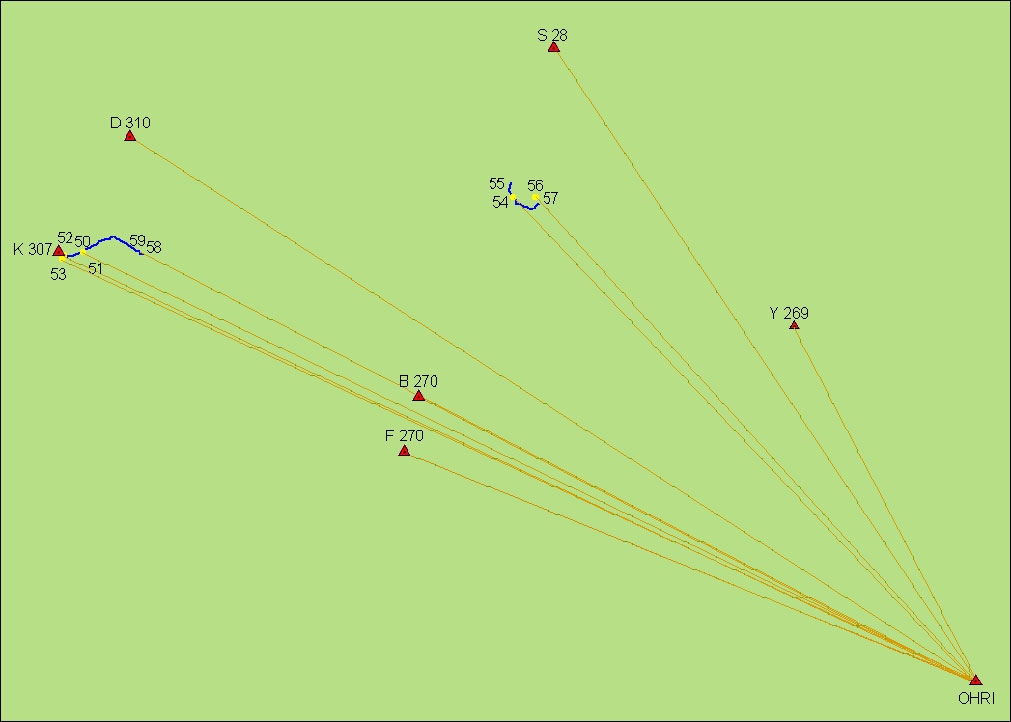
Small Scale Project
For this study, one semi-permanent RTK base station was established (the point in center labeled BASE). This location minimized baseline lengths and provided a convenient setup point; 9 sets (6 sets at structures and 3 sets at open-channel sites) of temporary control points (survey nails or hubs) were established using RTK surveying. Using trained personnel and four GPS units, the field part of the static control network and the RTK surveying was completed in about 1.5 days. Small Scale Project with RTN
Hydrographic Surveys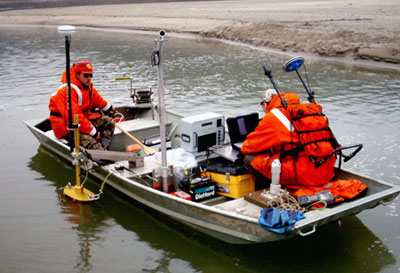
OverviewMaritime and river navigation are primary components that initiated the field of hydrographic surveying. Applications such as volume assessment for water supply and flood-control reservoirs, construction over waterways and adjacent inland development, flood and habitat studies, and many forms of recreation all require the need for underwater surveys. The U.S. Geological Survey water science centers primarily have been involved with lake and river surveys that combine GPS with survey-grade echo sounders to collect bathymetric data. The most important information collected during hydrographic surveys is the water surface elevation. Echo sounders only provide a depth, so to create an elevation map of the bottom that will be useful at other water levels, the current water surface elevation must be determined. Determining water surface elevation can be done in three ways; it can be determined from daily stage data (typical only applicable in reservoirs), it can be determined before and after surveying using typical Real-Time Kinematic (RTK) roving techniques, or it can be determined from an accurate GPS elevation in real-time where the receiving GPS antenna is mounted on the boat at a known offset from echo sounder and the water surface . Determining water surface elevation in lakes and reservoirs is often done differently than in rivers because stage does not change as rapidly and because there is no slope to account for. Regardless of how water surface elevation is determined position must also be collected during the hydrographic survey. ApproachMost lake surveys utilize differential GPS (DGPS) when collecting data along predetermined transects throughout the water body. DGPS is used to determine position, however, DGPS elevations are typically not accurate enough to determine water surface. The DGPS positions are collected and time tagged to relate to time-tagged survey-grade echo sounding data, often with a latency or correction. Stage data or typical RTK roving techniques are often used to get water surface elevation during lake and reservoir survey. If RTK methods are used, then known references marks (benchmarks) must be located or established near the survey area. Establishing datum (benchmarks) at lakes and reservoirs requires a GPS survey-grade approach that entails RTK or Static methods of solution development. A synopsis of approaches are provided below:
River surveys typically are performed in the same manner as lake surveys; however, positioning along a reach of river typically is done using RTK. RTK positioning is typical used because real time water surface elevations can be collected and account for the changing stage of the river and the slope that experienced along the study reach. If DGPS is used during river surveys, RTK still is necessary to take several water surface elevations along the survey reach at several times throughout the survey so post processing can be completed to accurately calculated the changing stage and the slope of the water surface. If RTK is used for both positioning and water surface elevation during the survey, it is important to maintain radio link. The following can be done to ensure communication:
When RTK GPS is used for positioning and water surface elevation the GPS antenna should be mounted in a secure position on the boat. Offsets from the base of the antenna to water level accounting for water displacement of the boat and mounting equipment and to the echo sounder must be determined (these offsets allow the surveyor to determine water surface elevation from the GPS elevations and echo sounder location from the GPS position). Similar to lake surveys, RTK data is time tagged to relate to time-tagged survey-grade echo sounding data. Although centimeter level accuracies are achievable for RTK positioning, confidence in vertical solutions are degraded because of boat draft, platform stability, boat speed, and subsurface material density (Wilson and Richards , 2006). Hydrographic surveys incorporating an Inertial Measurement Unit (IMU) have improve accuracy because the motion of the boat is calculated and accounted for in the depth estimates. More information pertaining to vertical accuracy of hydrographic surveys is available within the following publication: http://pubs.usgs.gov/sir/2006/5208/pdf/SIR-06-5208.pdf ExamplesBathymetric Surveying with GPS and Heave, Pitch, and Roll Compensation The Water Information Coordination Program (WICP) ensures collaborative efforts among Federal Agencies to improve water information for decision making about natural resources management and environmental protection (http://acwi.gov/wpinfo.html). The Advisory Committee on Water Information (ACWI) represents the interests of water-information users and professionals in advising the Federal Government (http://acwi.gov/aboutus.html). The ACWI has developed a subcommittee on sedimentation that promotes and supports development and standardization of equipment, methodologies, tools, and calibration and performance criteria for the collection, analysis, interpretation, interchange, and dissemination of fluvial-sediment data and related technical information (http://acwi.gov/sos/). The subcommittee on sedimentation has developed the REServoir SEDimentation Database (RESSED), which among other things, provides access to bathymetric and topographic surveys for reservoirs throughout the nation. This Web portal allows input of new and existing survey data and can be accessed at the following URL. http://ida.water.usgs.gov/ressed/index.cfm Light Detection and Ranging (LiDAR)Overview
LiDAR scanning can be collected from a number of platforms, including satellites, aircraft, boats, automobiles, or stationary tripods. When the LiDAR instrumentation is mounted on the satellite or aircraft and laser pulses yield vertical measurements of the ground surface, vegetation, and infrastructure with limited data on vertical faces. The accuracy of LiDAR scans correlate to the distance of the instrument from the surface measured; therefore, scans from aircraft typically are more accurate than scans from satellites. LiDAR deployed from boats or automobiles are not typically capable of surveying high overhead structures, but they can be used to survey greater details of vertical faces such as buildings, roadsides, stream banks and lake shores. When LiDAR data is collected in motion (satellites, aircraft, boats, and automobiles) instruments used to detection motion must be using in coordination with GNSS equipment to correct the LiDAR data for the movement of the instrument. LiDAR instruments deployed in the field from a tripod, similar to a total station, have the advantage of being very accurate (because the error in the motion correction is eliminated) and are often used to survey vertical faces and detail infrastructures both indoors and outdoors. The Center of LiDAR Information Coordination and Knowledge (CLICK) operated by the USGS maintains a webpage to facilitate data access and user coordination and education of LiDAR remote sensing for scientific needs. This webpage provides a bulletin board style forum, data viewer, websites and references, and media and documents for LiDAR. Types of LiDAR
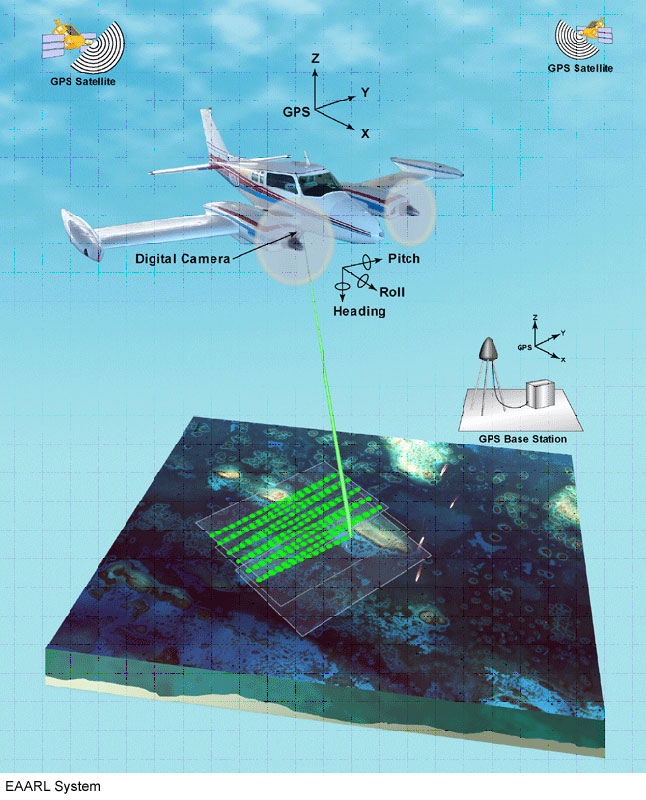
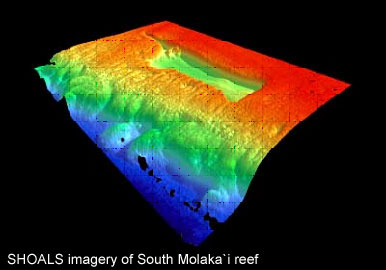
The SHOALS, Hawk Eye, and LADS are of similar design using two separate wavelengths of light, infared and green. The sampling rate for the green laser pulse is much slower (approx. 1,000 soundings per second) than the infared laser; however, a longer pulse with more power typically is used. The EAARL LiDAR system operates in the blue-green light spectrum. This system operates at a high sampling rate with a shorter pulse and much less power. Ground-based LiDAR (terrestrial LiDAR) are portable and light tripod-mounted systems that can be deployed easily to scan surfaces. Ground-based LiDAR typically can scan surfaces from 2 meters to 1,000 meters (6.6 ft to 3,280 ft) (ideal conditions) and are used for small-scale, high-resolution scanning. Similar to total stations used for traditional surveys, the ground-based LiDAR units rely upon line-of-sight to survey or scan surfaces. Ground-based LiDAR can be deployed from a traditional tripod or from an extendable 4.5 m (14.8 ft) tripod to look down on the survey area. Surveying with a tripod LiDAR instrument usually must be completed from a number of different setups to eliminate shadows and to get a complete 3-dimensional survey. Scanning rates vary by the type of unit; however, ground-based units typically can scan upwards of 100,000 points per minute. Units available within the USGS are listed in the following table:
LiDAR AccuracyThe accuracy of LiDAR data depends on many variables; however, accuracies of 0.5 - 1 ft vertical (0.15 m - 0.30 m) generally can be expected for LiDAR data collected from an aircraft. Some of the variables that affect the LiDAR accuracy include atmospheric conditions, GPS control quality, geoid model quality, laser reference frame and scanner angle calibration, grade-break definitions, and percent of leafy foliage covering the ground. An excellent article discussing LiDAR accuracy is available in Point of Beginning magazine. Several reports and journal articles have been published by the USGS and others which evaluate the accuracy of LiDAR for topographic and bathymetric surveys. A list of selected references follows: 
These are just a few of the references that are available for use of LiDAR. Many more references can be found by searching the USGS publications warehouse and the Web. The USGS Web page, CLICK also lists many references and publications. In addition The Professional Surveyor Magazine is available online at http://www.profsurv.com/magazine/currentedition.aspx which typically has a number of interesting LiDAR articles. Supplementing and Ground-Truthing LiDAR Surveys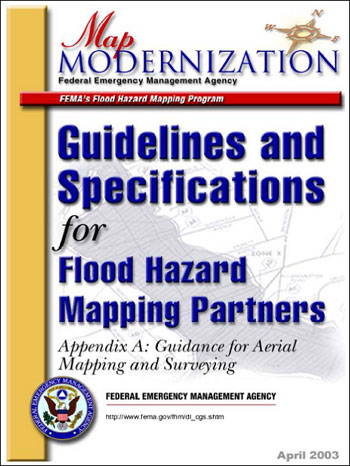
Aerial LiDAR surveys for topographic and bathymetric purposes can be surveyed and processed to provide relatively accurate ground coordinates for channels and overbanks; however, LiDAR surveys require supplemental surveys to define additional points throughout the study area, and also require surveys to quantify inaccuracies of the LiDAR survey. LiDAR surveys typically are accurate for areas that have little or no vegetation and are gently sloping with no abrupt changes in the slope; areas that are heavily vegetated or have multiple abrupt changes in slope (typical for river environments) need additional surveys to better define these areas. Survey-grade GPS (typically RTK) and total stations commonly are used to further delineate these areas where LiDAR surveys are less accurate. Supplemental surveys need to focus on breaks in slope, such as the top of bank, toe of bank, and possibly the thalwag of the river. These surveys commonly are referred to as longitudinal surveys as the purpose is to focus on the line feature that defines the break in slope. Depending on the scope of the project, these longitudinal surveys may need to be performed only in the active channel (typically defined as bankfull);however, flood control features such as dikes, dams, roads, and bridges likely will need to be surveyed using traditional (RTK-GPS and total stations) methods. Supplemental surveys also may be required in areas where the LiDAR data could not define the bottom of the channel because of high turbulence, too much suspended sediment, or depths greater than the ability of the LiDAR to penetrate. These areas may not be identified until after the LiDAR survey data have been collected and partially processed. Information from these supplemental surveys may be processed with the LiDAR data to define line features during the development of the TIN model. Additional surveys (evaluation surveys) are required to evaluate the accuracies of the aerial LiDAR survey collected within the study area. Surveys are typically performed using traditional survey methods to determine bare-earth, or true ground coordinates. The scope of the evaluation surveys is to survey points on gradually sloping ground in every type of vegetation. It is important to remember that evaluation surveys are performed a minimum of 5 meters away from major breaks in slope, structures, or vegetation as LiDAR data typically are accurate to only a couple meters in the horizontal plane. Evaluation surveys require notes or attributes referring to the general type and height of the ground cover. A general rule of thumb is to collect 100 survey points per square kilometer weighted proportionally to the vegetation types present and distributed throughout the study area. Traditional surveys and/or bathymetry surveys also should be performed in the channel to evaluate the bathymetry data collected during the LiDAR survey. Cross-section surveys should be performed in every type of channel feature within the study area. The number of cross sections needed to evaluate the LiDAR survey data will vary greatly based on the scope of the study and the size of the study area; however, a minimum of three cross sections should be surveyed for each channel feature throughout the study reach. The Federal Emergency Management Agency (FEMA) has compiled an excellent set of guidelines for aerial mapping and surveying (Guidelines and Specifications for Flood Hazard Mapping Partners; Appendix A: Guidance for Aerial Mapping and Surveying) that details techniques and methods that should be used for performing supplemental and evaluations surveys for LiDAR surveys. Survey methods and techniques for collecting supplemental and evaluation surveys are the same as those defined for RTK-GPS above. Total station surveys also can be seamlessly incorporated into the RTK-GPS in the "GPS Surveying for Flood Insurance Study" surveys as described above. Processing of ground based LiDAR requires that all separate scan be aligned into a common reference frame, this typically can be completed with minimum error introduced. In areas were there are not unique structures to align to, the surveyor may have to place objects in the scan field that will aid in alignment and can be used for geo-referencing if that is necessary for the survey. Evaluation of ground-based LiDAR is similar to aerial LiDAR in that areas of thick ground vegetation and wet surfaces not have surface returns, and therefore will not be able to be used to define the topography in that area. This means that additional surveys, typically GPS or total station, will need to be conducted in those areas to adequately map the area. Unlike aerial LiDAR, vertical surface which are clear of vegetation will be well defined in ground-based LiDAR surveys and will not require additional surveying. |

![]() U.S. Department of the Interior |
U.S. Geological Survey
U.S. Department of the Interior |
U.S. Geological Survey
URL: http://water.usgs.gov/osw/gps/GPS_projects.html
Page Contact Information: Contact USGS
Page Last Modified: Tuesday, 25-Feb-2014 09:07:54 EST