USGS Groundwater Information
|
USGS Groundwater Information > July 2, 2019 USGS Monthly Groundwater News and Highlights: July 2, 2019Subscribe to get the latest USGS groundwater news and science sent to your inbox every month! ![[ This figure shows a triangular grid in which the size of the triangular cells is reduced in areas with relatively large hydraulic gradients ]](images/feature/20190701_mf6-triangular-grid_small.png "This figure shows a triangular grid in which the size of the triangular cells is reduced in areas with relatively large hydraulic gradients")
This figure shows a triangular groundwater model grid from MODFLOW 6, in which the size of the triangular cells is reduced in areas with relatively large hydraulic gradients, such as around the shoreline of a lake, near pumping wells, and along a stream. Feature: Groundwater Modeling Tools You Can UseAs part of USGS groundwater science activities, USGS scientists develop state-of-the-science software tools to support our science. USGS's modular hydrologic model, MODFLOW, is considered an international standard for simulating and predicting groundwater conditions and groundwater/surface-water interactions. The USGS releases multiple versions of MODFLOW and related utilities, including:
MODFLOW and related programs are released as open source in the public domain. These software packages can be downloaded freely from the USGS web site for use by scientists, resource managers, students, and any member of the public. 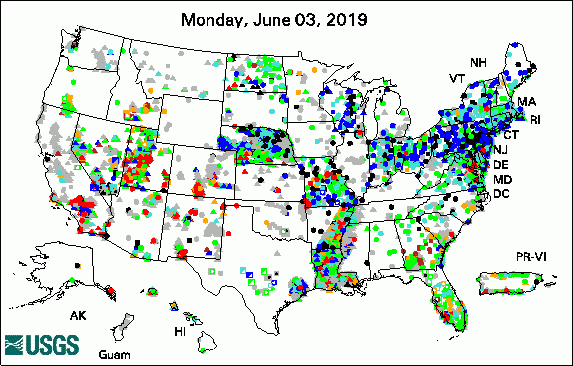 
The USGS Active Groundwater Level Network includes about 20,000 wells that have been measured by the USGS or USGS cooperators at least once within the past 13 months. The animation shows a daily snapshot of water-level statistics in the network for June 2019. Credit: USGS. The image is in the public domain. USGS Groundwater-Related PublicationsWater resources of East Carroll Parish, Louisiana (06/27/19) Water resources of Jackson Parish, Louisiana (06/27/19) ModelMuse Version 4: A graphical user interface for MODFLOW 6 (06/25/19) Water resources of Richland Parish, Louisiana (06/21/19) Water resources of Tensas Parish, Louisiana (06/14/19) Water Resources of West Carroll Parish, Louisiana (06/18/19) Water resources of Morehouse Parish, Louisiana (06/18/19)
USGS Groundwater Flow and Transport Model Data ReleasesField PhotoUSGS scientists develop tools to help us better observe and monitor groundwater conditions in the field. These photos show a temperature profiling probe developed by scientists in the USGS Nevada Water Science Center. The TROD (for temperature rod) can be installed into stream sediment to measure temperature in sediment and (or) surface water. USGS scientists study water temperature for many reasons. For example, water temperature can be an important factor in the suitability of fisheries habitat, and streambed temperature data are useful for understanding the interactions between surface water and groundwater. However, measuring vertical temperatures at the streambed interface poses practical challenges. USGS designed the TROD to address some of these challenges: the TROD does not need to be moved to retrieve data from the sensors, and its low-profile design allows it to be used for continuous monitoring even in harsh environments with rapidly moving debris or sediment. More information about the TROD is available online. In the top photo, a USGS scientist is holding a TROD during installation. The yellow cable is a communications cable for connecting with the sensors and downloading data. The bottom photo is a close-up image of the stick-up height of the TROD after installation in a dry streambed. ![[ Photo of scientist holding a rod with a yellow cable connected ]](images/field/20190701_trod-field.png "Photo of scientist holding a rod with a yellow cable connected")
Credit: USGS/David Smith. Photo is in the public domain. Click on photo for larger version. ![[ Close-up photo of the TROD after installation in a dry streambed ]](images/field/20190701_trod-closeup.png "Close-up photo of the TROD after installation in a dry streambed")
Credit: USGS/David Smith. Photo is in the public domain. Click on photo for larger version. Archive of Past Highlights: |
![]() U.S. Department of the Interior |
U.S. Geological Survey
U.S. Department of the Interior |
U.S. Geological Survey
URL: http://water.usgs.gov/ogw/highlights/2019-07-01.html
Page Contact Information: Contact the USGS Office of Groundwater
Page Last Modified: Wednesday, 03-Jul-2019 13:21:52 EDT
