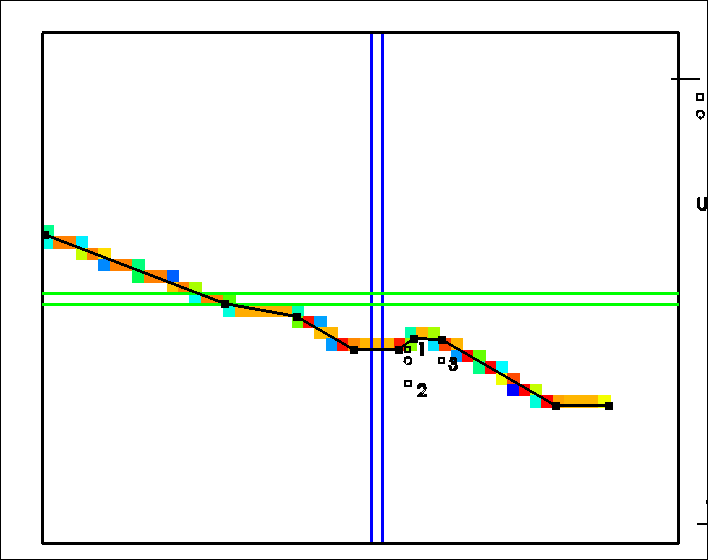
One of the objects imported from the DXF file represents the river. If the object is not visible, select "Object|Show or Hide Objects" and check the check box next to "All Objects."
Double-click on the object that represents a river to display the Object Properties dialog box. Change the name to something appropriate. Check the Set values of intersected cells check box and change the Number of Z formulas to One. The edit box for the Z-coordinate formula will be come enabled and will contain "(Model_Top + Aquifer_Bottom) / 2." That puts the river in the middle of the aquifer in the vertical direction.
Change to the MODFLOW Features tab and check the checkbox on the left for the River package. Change the Number of times to 1. Enter the following data in the table.
Starting time |
Ending time |
River stage |
Conductance |
River bottom |
0 |
180000 |
0 |
0.0002 |
-10 |
Keep the Conductance interpretation set to Calculated. The Calculated option for Conductance interpretation makes the conductance be treated as a conductance per unit length (for polylines) or conductance per unit area (for polygons). For models where the cells vary in size, the Calculated option is definitely preferable because it keeps the flow though the cell proportional to its size as it should be. (In the original model the conductance was 0.02 for all the cells. For a model with a uniform cell size, such as this one, it probably doesn't much matter which method is used. (To more closely match the original model, it would have been possible to choose the Direct option for Conductance interpretation and set the conductance to 0.02.) Click OK to close the dialog box.
Try coloring the grid with the river conductance. (Use the Color Grid pane of the Data Visualizationdialog box as before. The river conductance is classified under "Boundary Conditions, Observations, and Other Features|MODFLOW River.") The distribution of conductance should look similar to the figure 131.

Figure 131. Grid colored with river conductance.