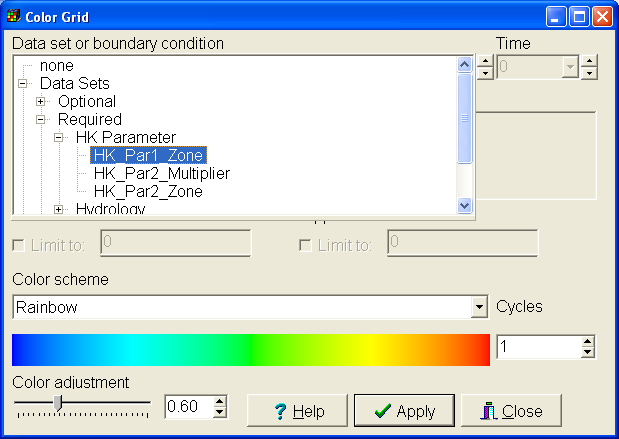
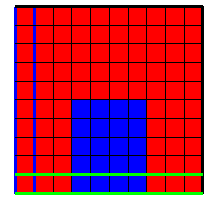
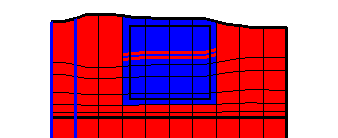
To see the zone array for HK_Par1, select Data|Data Visualization|Color Grid...  to show the Color Grid pane of the Data Visualization dialog box, and then select "HK_Par1_Zone" from "Data Sets|Required|HK Parameter" and click Apply (fig. 73). The blue zone is the area where HK_Par1 applies (fig. 74). However, by using the Show or Hide Objects dialog box (Object|Show or Hide Objects
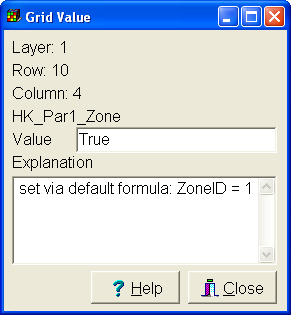
  ) to identify the objects used to define this zone, it can be seen that no such objects exist because no objects are listed for HK_Par1_Zone. To figure out what is happening, select Data|Show Grid or Mesh Values... Move the mouse over the top, front, or side view of the grid. When the mouse is over the blue cells, the "Value" is displayed as "True." When the mouse is over the red cells, the "Value" is displayed as "False." For both types of cells, the explanation that is shown is "set via default formula: ZoneID = 1" (fig .75). In this case, the value was set via the default formula for the data set. To see this default formula, switch to the main ModelMuse window and select Data|Edit Data Sets... In this case the default formula has been set to "ZoneID = 1." ZoneID is a user-created data set. (Expand "User Defined" to see it.) ZoneID is being used to set the value of two data sets. It is used to set HK_Par1_Zone through its formula: "ZoneID = 1." It is also being used to set the value of another data set HK_Par2_Zone using a different formula "ZoneID <> 1." Thus setting a value for ZoneID simultaneously sets values for both HK_Par1_Zone and HK_Par2_Zone. Use the Show or Hide Objects dialog box to hide all the objects except the one that sets the value of ZoneID. (Display the Show or Hide Objects dialog box if it is not already visible. Uncheck the checkbox next to "All Objects" if it is not already unchecked. Expand "Data Sets|User Defined" and check the check box next to "ZoneID.") The object is on the front view of the model (fig. 74B).
 |
Figure 73. Selecting the HK_Par1_Zone data set in the Color Grid dialog box. |
 |
 |
A |
B |
Figure 74. The blue area represents the area where HK_Par1 applies—(A) Top view, and (B) Front view. |
|
 |
Figure 75 Grid or Mesh Value dialog box. |