RmaSutra: Visualize Residuals |
RmaSutra: Visualize Residuals |
PEST prints the weighted residuals and other information from the run with the best fit in a .res file. Data from this file can be plotted on the top view of the model or in a graph using the PEST Observation Results pane of the Data Visualization dialog box.
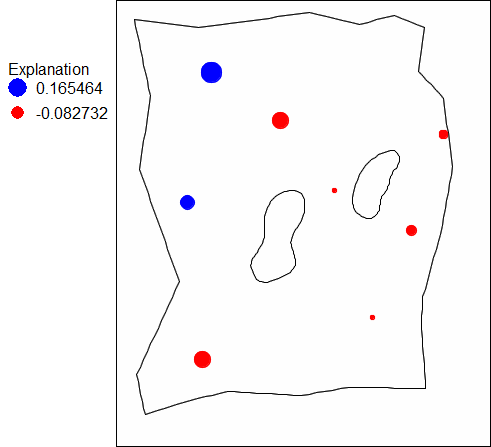
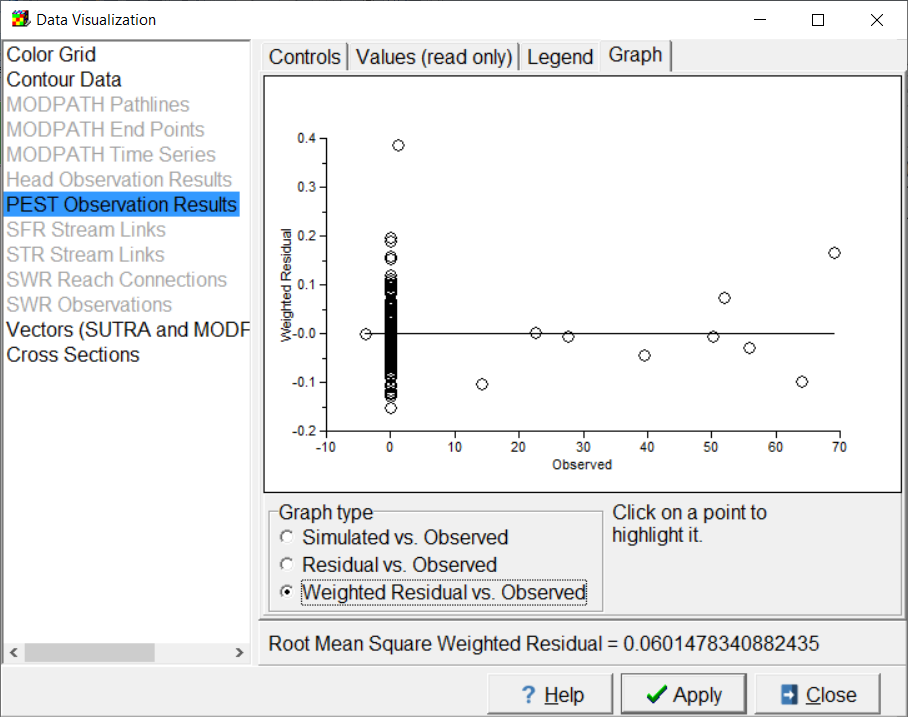
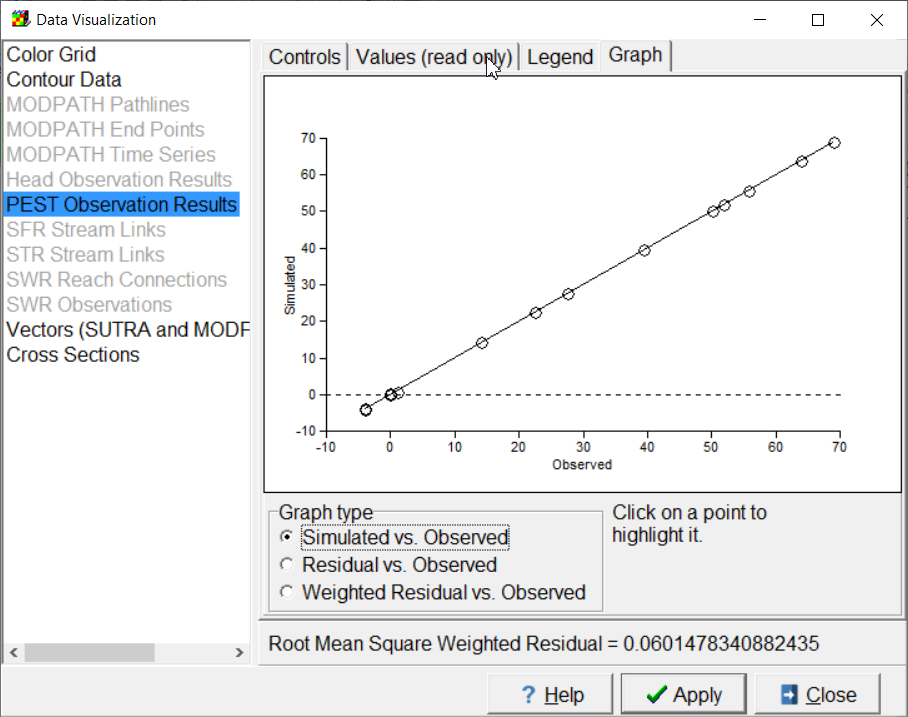
Select Data|Data Visualization and select the PEST Observation Results pane. Select the .res file for the model and click the Apply button and the weighted residuals will be plotted on the top view of the model as shown in the first figure below. Only observations associated with a single object that has a single vertex will be plotted. Weighted residuals for prior information equations are not plotted. In addition, the Graphs tab can show plots of simulated values, residuals, or weighted residuals vs. observed values. Ideally, the weighted residuals should be equally distributed on each side of the zero line on the graph as shown in the second figure below. The simulated values should all lie close to the 1:1 line of simulated vs observed as shown in the third figure below.

Plot of weighted residuals following parameter estimation in a SUTRA model.

Screen capture showing graph of weighted residuals vs observed values in a SUTRA model.

Screen capture showing graph of simulated values vs observed values in a SUTRA model.