MODFLOW 6 Example: Displaying Model Results |
MODFLOW 6 Example: Displaying Model Results |
ModelMuse can display some of the results from MODFLOW 6. Usually, it is a good idea to check the calculated heads in the model.
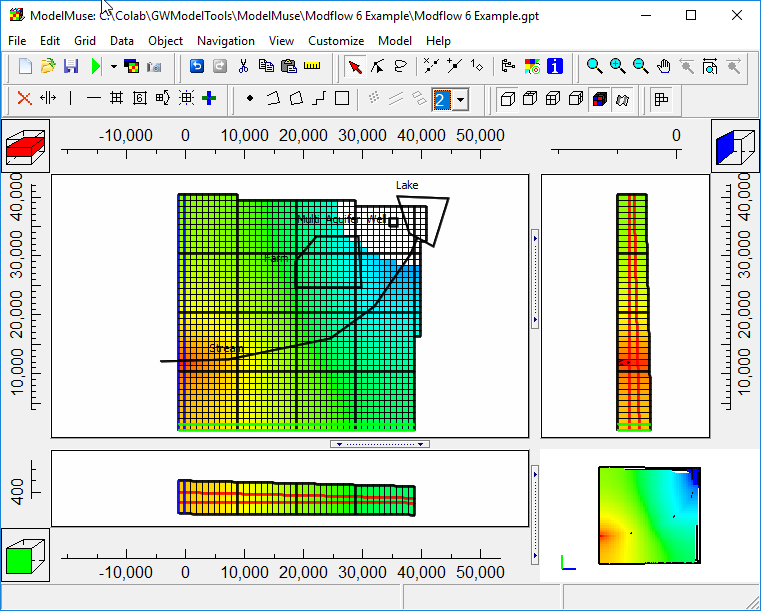
1.Click the "Import and display model results" button  . The binary head file (.bhd) should be selected by default in the Open File dialog box.
2.The Select Model Results to Import dialog box will appear with a list of data sets that can be imported. For this model, the only data set is the heads for the one and only time step in the model.
3.You can choose to color or contour the data (or do neither) and you can select a data set to use for coloring or contouring. Make whichever choices you want an click OK to import and display the model results.You can switch layers to see results for different layers.

Model Heads
4.If you look at the Legend tab on the Data Visualization dialog box, you'll see that some of the heads are above 500 which is the highest elevation in the model. That's a clue that the heads may be too high.
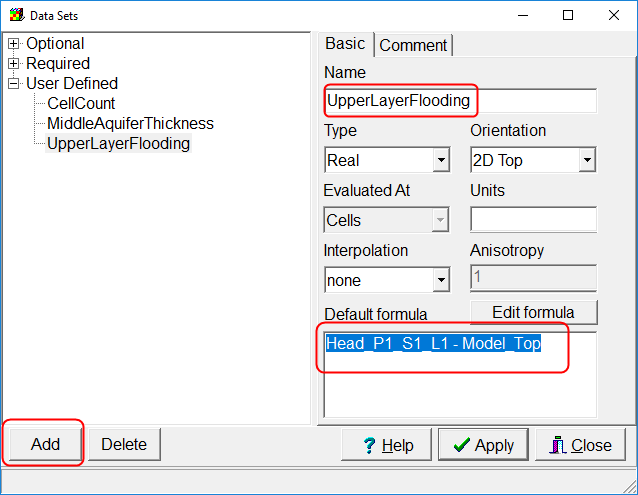
5.To see how prevalent this problem is, we'll create a new data set that will calculate the head in the top layer minus the top of the model. Select Data|Edit Data Sets.
6.Click the Add button and name the new data set "UpperLayerFlooding." Set its default formula to "Head_P1_S1_L1 - Model_Top."

Test for heads that are too high
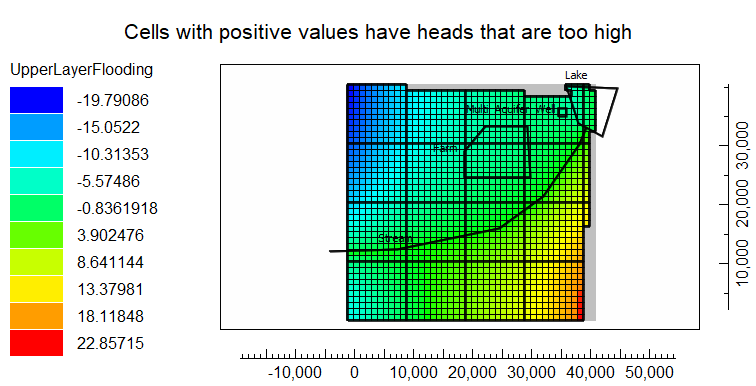
7.Now color the grid with the new data set. It looks like there are a large number of cells in which the head is too high. (The image below was created using the Export Image Dialog Box.)

Map of the difference between the head and the top of the model
8.Problems of this sort are not uncommon in the early stages of model development. It indicates that water is entering the system faster than groundwater flow can redistribute it elsewhere in the model. That might mean that recharge is too high or that the hydraulic conductivity is too low. You can try modifying the model to improve the results.
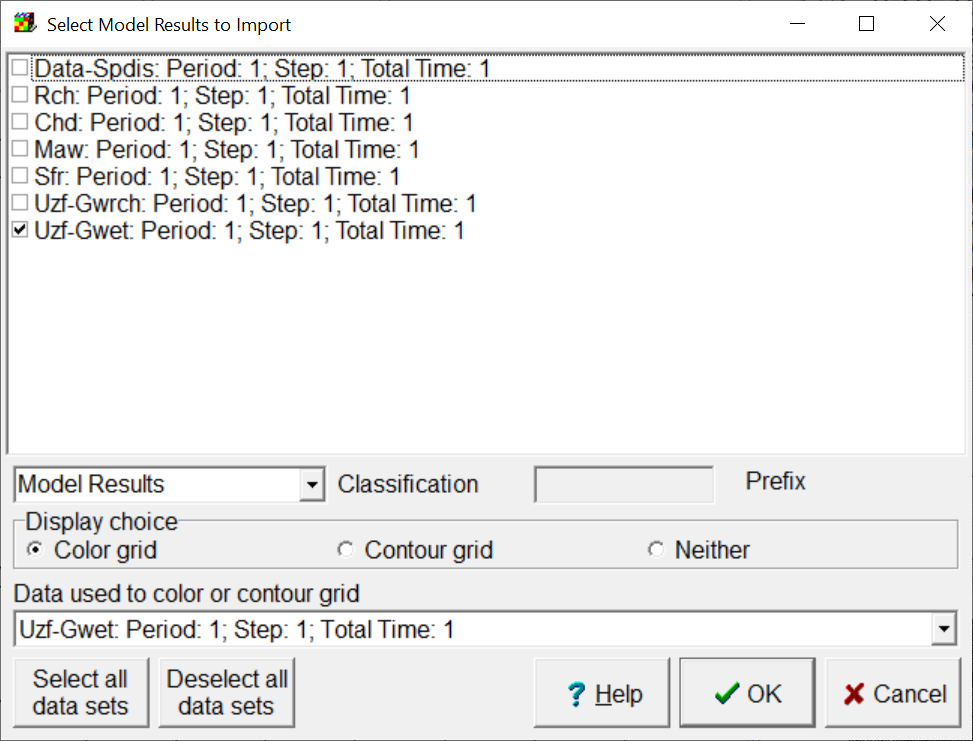
9.You can also import some of the flow terms for the model. Click the "Import and display model results" button  again. This time select the cell-by-cell (.cbc) flow file. For this example, I suggest importing all the data sets. The Data-spdis represents the components of specific discharge in the X, Y and Z directions. try coloring the grid with all the data sets. When doing so, try specifying 0 as a value to ignore on the filters tab of the Display Data dialog box.

Import flow terms