MNW2: Multi-Node Well Package (Version 2) Pane |


MNW2: Multi-Node Well Package (Version 2) Pane |
 Scroll to Top of Page
 Print Topic
 Show/Hide Expanders
The MNW2: Multi-Node Well package pane is on the MODFLOW Features tab of the Object Properties dialog box. Each object in which the MNW2 package is active defines one multi-node well.
The MNW2: Multi-Node Well package pane has five tabs. Only the tabs that contain options that can be used for the multi-node well that is being edited will be visible.
The Basic tab contains controls relating to the various options that may be specified for the well.
If the model for well loss is not equal to NONE, the Loss Controls tab will be visible. On it, the user specifies the data required for the selected loss model. Note that the model for well loss is only allowed to be NONE for wells that are only in a single cell. The data on the Loss Controls tab will not be used if well screens are defined on the Well Screens tab.
The MNW2 package allows the pumping rate to decrease as lift increases. To use this option, check the PUMPCAP checkbox and the Discharge Adjustment tab will appear.
The user must specify the pumping rate and other time varying data on the Pumping Rate tab.
If a vertical well has multiple screened intervals, those screened intervals can be specified on the Well Screens tab and the data on the Loss Controls tab will be ignored.
It is relatively simple to draw a vertical multi-node well; use a point object drawn on the top view of the model. The elevations determined by the Higher Z coordinate and Lower Z coordinate on the Properties tab will define the location of the well screen (unless well screens are defined on the Well Screens tab instead).
Drawing a horizontal multi-node well is also relatively simple; use a line object with a single Z coordinate drawn on the top view of the model.
Drawing a slanted multi-node well can be accomplished using a line object with a single Z coordinate drawn on the top view of the model. However, in that case, the formula for the Z coordinate must vary along the length of the object. Two functions that can be used for that purpose are VertexInterpolate and InterpolatedVertexValue. In the figure below, the formula for the Z coordinate of the blue line object is "VertexInterpolate(-3, -11)." On the front view of the model, the line representing the object is drawn through the center of each cell intersected by the object.
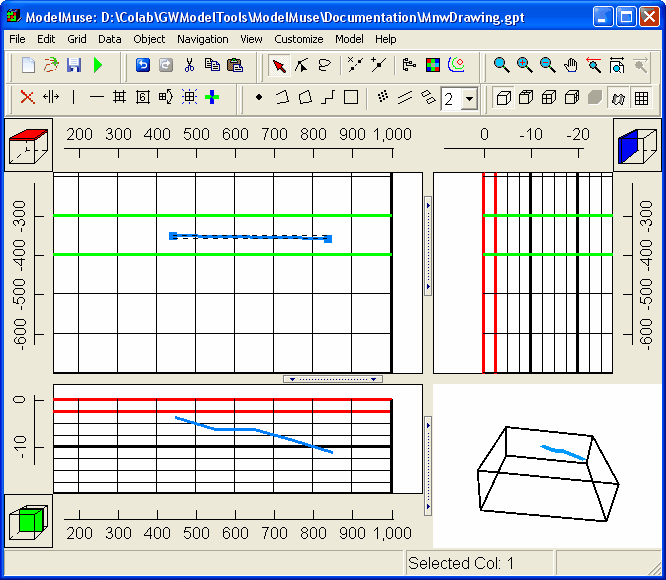 |
Model in which VertexInterpolate is used to define a slanting multi-node well. |
Drawing a multi-node well with both a vertical and a slanted section requires a combination of the techniques required to draw vertical and slanted wells. In the figure below the orange object has two sections. The first section is a single point and the second section is a line segment. The formulas for the Higher Z coordinate and Lower Z coordinate are as follows.
•Case(ObjectCurrentSectionIndex, 0., VertexInterpolate(0, -11, -21))
•Case(ObjectCurrentSectionIndex, -11., VertexInterpolate(0, -11, -21))
For the first section, the higher and lower z coordinates work out to be 0 and -11 respectively so they define the vertical section of the well. The elevation for the second section are interpolated between vertexes 2 and 3 which define a line that slopes from an elevation of -11 to an elevation of -21.
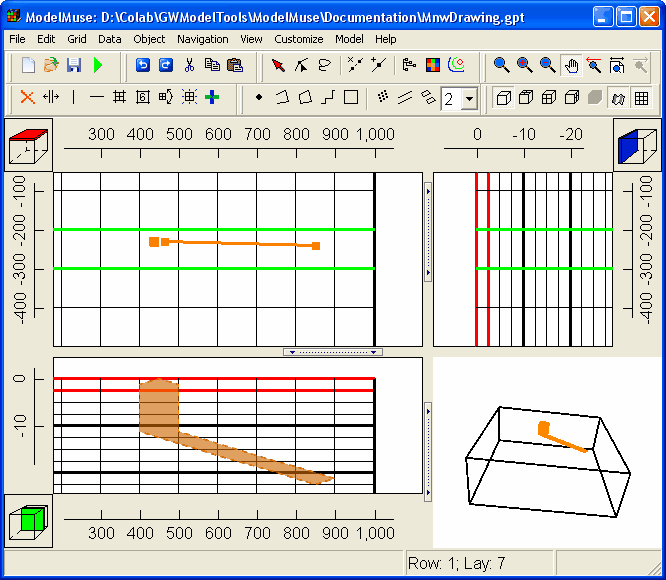 |
Model in which an object with two sections is used to define a multi-node well with a vertical section and a slanted section. If PEST is activated, a Calibration tab will be visible where calibration observations can be defined. |