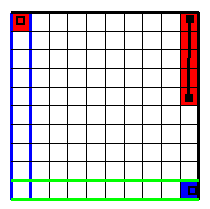
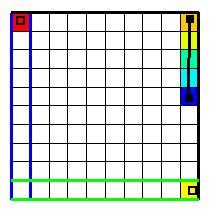
Next make sure the top layer of the grid is selected. (Use the red square on the upper left to select the top layer.) Then color the grid with the CHD Starting Head. (Select Data|Data Visualization|Color Grid... and then select "Boundary Conditions, Observations, and Other Features|MODFLOW CHD|CHD Starting Head." The distribution of starting heads will be similar to that as in figure 86A below. Now change the value of the first CHD parameter from 30 to 20. The distribution will change so it looks like figure 86B. (Change the parameter value by first selecting Model|MODFLOW Packages and Programs... Then choose the CHD package under "Boundary Conditions|Specified Head." The CHD parameters will be listed. Change CHD_Par1 from 30 to 20.) Try using the Grid or Mesh Values dialog box (Data|Show Grid or Mesh Values...) and moving the cursor along the polyline object to see how the starting heads are assigned. The starting head for the line object in the upper right are assigned by combining the results of the two parameters that are used with that object. (Be sure to place the cursor over one of the colored cells. No value will be displayed for the other cells because the CHD boundary is not defined for the other cells.)
 |
 |
A |
B |
Figure 86. Starting head for CHD package (A) before and (B) after changing a parameter value. |
|