National Water-Quality Assessment (NAWQA) Project
Go to:
Why study pesticides? | BACK TO QUESTIONS |
Over half a billion pounds of synthetic organic pesticides are used each year in the United States to control weeds, insects, and other pests. The use of pesticides has resulted in a range of benefits, including increased food production and reduction of insect-borne disease, but also raises questions about possible harm to the environment, including potential effects on drinking-water sources and aquatic life.
How are pesticides released into the environment? | BACK TO QUESTIONS |
Pesticides are released into the environment primarily through their application to agricultural lands, including croplands, orchards, and pastures, and for non-agricultural pest control, such as on lawns and gardens, commercial areas, and rights-of-way. In 2007, agriculture accounted for over three-quarters of total national use, with the remaining amount being applied for a wide range of non-agricultural purposes. The National Water-Quality Assessment (NAWQA) Program focuses primarily on “nonpoint” sources of pesticides resulting from applications for pest management, although some sites downstream from major metropolitan areas also may be influenced by point sources, such as discharges from wastewater-treatment plants.
Where can the general public get information on individual pesticides? | BACK TO QUESTIONS |
Information about selected pesticides can be accessed in EPA fact sheets http://www.epa.gov/pesticides/factsheets/index.htm . These fact sheets provide technical information on pesticides; for example, information about newly registered pesticides and re-registration eligibility decisions made on individual pesticides, and information on biological pesticides. The National Pesticide Information Center, a cooperative effort of EPA and Oregon State University, also has many informative fact sheets on a myriad of individual pesticides (http://npic.orst.edu/npicfact.htm)
What pesticides did NAWQA study? | BACK TO QUESTIONS |
NAWQA measured the broadest range of pesticide compounds ever addressed in a national study. Even so, many pesticides in current use and most pesticide degradates were not measured. During 2002-2011, the NAWQA assessment included 123 pesticides and pesticide degradates. Although pesticide compounds analyzed by NAWQA represent many of the heavily used herbicides and insecticides, they only included a fraction of the more than 400 pesticides currently in use, and few of their degradates. NAWQA findings can provide insights about what to expect for those pesticides not measured, but must be considered as only a partial assessment of currently used pesticides.
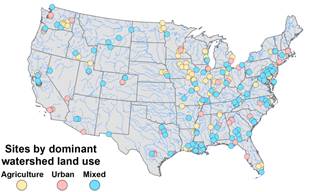
What sites were assessed for pesticides? | BACK TO QUESTIONS |
NAWQA assessments of pesticides included 182 sites during 1992-2001 and 125 sites during 2002-2011. These sites are located across the Nation, from Florida to the Pacific Northwest. The sites are representative of the Nation’s major hydrologic landscapes, and agricultural and urban sources of pesticides.
How do the individual NAWQA sites fit into a national design? | BACK TO QUESTIONS |
Sampling at each of the sites throughout the 20-year period of analysis followed a nationally consistent approach and used uniform methods of sampling and analysis. Water-quality conditions in a specific locality or watershed can be compared to those in other geographic regions and at different periods of time. Collectively, the assessments advance an understanding of the quality of our Nation’s waters and whether water quality is getting better or worse over time.
Are other national assessments of pesticides available? | BACK TO QUESTIONS |
The NAWQA assessments of pesticides provide the most comprehensive national-scale analysis to date of pesticide occurrence and concentration trends in streams and rivers. Data are also collected by States, Tribes, utilities, localities, and other organizations, providing excellent focused assessments for these areas, but not at the national scale.
How were NAWQA sampling sites selected? | BACK TO QUESTIONS |
NAWQA sampling sites are part of a “targeted” monitoring design that focuses on understanding the relations between water-quality conditions and the natural and human factors that cause those conditions. Monitoring sites are not selected randomly; they represent certain human activities, environmental settings, or hydrologic conditions during different seasons or times of year. For example, sites may be selected to assess the effects of agriculture and urban development on pesticide and nutrient contamination in streams. Sampling locations for streams and rivers were selected or “targeted” to represent specific agricultural, urban, and mixed land-use settings of greatest significance to water resources in the primary hydrologic settings. Sites were selected by local teams in collaboration with local organizations, States, and Tribes, as well as NAWQA national teams. Streams and rivers were sampled most intensively in agricultural and urban areas because of the importance of assessing pesticide occurrence in areas where the compounds are used most intensively. This NAWQA approach focuses on achieving an understanding of the relations between water-quality conditions—such as related to pesticide occurrence—and the natural and human factors that cause those conditions. The assessment did not focus on specific sites with known water-quality problems or narrowly defined “issues of the day,” but rather on the condition of the total resource.
How does the NAWQA design and sampling-site selection differ from a probabilistic-monitoring design? | BACK TO QUESTIONS |
NAWQA uses a “targeted” monitoring design in which sites are selected to represent certain human activities, land uses, environmental settings, or hydrologic conditions during different seasons or times of year (see question above). Such monitoring is useful to answer questions related to water-quality conditions and the natural and human factors that cause those conditions. Probabilistic monitoring involves random selection of sites across a certain geographic area. Such monitoring is useful for getting an unbiased, broad geographic snapshot of “whether or not there is a problem” and “how big the problem is.” Many probabilistic monitoring programs implemented by the States and the U.S. Environmental Protection Agency (EPA) provide quantitative, statistically valid estimates of, for example, the number of impaired stream miles with a region or State (http://www.epa.gov/emap/) . Probabilistic monitoring and more “targeted” monitoring (such as by NAWQA) answer different types of questions and provide different types of information that are both critical for understanding the ambient resource. Ideally, data-collection and laboratory analytical methods should be consistent and comparable between the two methods so that findings can be integrated and conclusions can go beyond what each can provide individually.
What defines an “agricultural” and “urban” stream site in the NAWQA study? | BACK TO QUESTIONS |
“Agricultural” streams drain watersheds that contain greater than 50 percent agricultural land and less than 10 percent urban land. The agricultural streams sampled are diverse in climate, geography, and crop types, and span coastal, desert, and temperate environmental settings. Agricultural settings included, for example, areas dominated by production of corn in the Midwest; wheat in the Great Plains; poultry in the east; and vegetables in California. “Urban” streams drain watersheds that contain greater than 25 percent urban land and less than 25 percent agricultural land. The urban settings studied were primarily residential, typically with low-to-medium population densities (300 to 5,600 people per square mile).
Did the NAWQA study characterize drinking water? | BACK TO QUESTIONS |
None of the USGS stream sampling sites were located at drinking-water intakes. NAWQA assessments characterized the quality of untreated, ambient water resources in the Nation’s streams and rivers, and not the quality of finished, treated drinking water (as would be done by monitoring water from water-treatment plants or from household taps). By focusing on the quality of streams and rivers in their present conditions (ambient water quality), NAWQA complements many Federal, State, and local drinking-water monitoring programs.
How many streams were sampled? | BACK TO QUESTIONS |
Water samples for pesticide analysis that were included in this assessment were collected from 182 streams and rivers during 1992-2001 and 125 streams and rivers during 2002-2011.
How many samples were collected at each site? | BACK TO QUESTIONS |
Water samples were collected from streams throughout the year, including high-flow and low-flow conditions. Sampling was most intensive during the time of highest pesticide use and runoff—generally weekly or twice monthly for a 4- to 9-month period.
How are NAWQA data used by others? | BACK TO QUESTIONS |
Local, State, Tribal, and national stakeholders use NAWQA information to design and implement strategies for managing, protecting, and monitoring water resources in many different hydrologic and land-use settings across the Nation (http://water.usgs.gov/nawqa/xrel.pdf). For example, the Alabama Department of Agriculture and Industries states that “the NAWQA Program has filled a tremendous void in the pesticide data that the State of Alabama must acquire in the development of the EPA-mandated State Pesticide Management Plan. The NAWQA data are used to make important determinations and the plan can target the areas of greatest importance.”
USGS has worked closely with the U.S. Environmental Protection Agency (EPA) during the 20-year study. EPA uses the data extensively in their exposure and risk assessments for regulating the use of pesticides. (Learn more about how EPA regulates certain chemicals or types of pesticides at http://www.epa.gov/pesticides/factsheets/reg_fs.htm). For example, EPA used USGS data in its risk assessments for the reevaluation of diazinon, chlorpyrifos, cyanazine and alachlor. Uses of three of these pesticides (diazinon, chlorpyrifos and cyanazine) have now been significantly limited, and usage of alachlor was voluntarily reduced and largely replaced by a registered alternative. The USGS findings show strong relations between the occurrence of pesticides and their use, and point out that some of the frequently detected pesticides, including the insecticide diazinon and the herbicides alachlor and cyanazine, have declined. As new pesticides are approved for use, EPA will continue to need monitoring data to ensure that levels in the environment are safe.
Are pesticides present in stream water? | BACK TO QUESTIONS |
The simple answer is “yes”—pesticides are frequently present. One or more pesticide compounds were almost always present at detectable levels in stream water. There were detectable concentrations in water more than 90 percent of the time across all streams sampled that had significant agricultural or urban land use in their watersheds.
Which pesticides were detected most frequently in water? | BACK TO QUESTIONS |
The specific pesticides most frequently detected in water included herbicides used most heavily in agriculture, herbicides with major non-agricultural uses, and several insecticides. Three herbicides mainly used for agricultural purposes—atrazine, metolachlor, and acetochlor—were among the most frequently detected in agricultural streams and were more frequently detected in agricultural streams than in urban streams. In contrast, three herbicides commonly used in urban areas—simazine, prometon, and tebuthiuron—were detected more often in urban streams than in agricultural streams. Finally, insecticides were found much more frequently in urban streams than in most agricultural streams with diazinon, chlorpyrifos, carbaryl, and fipronil most frequently detected. Overall, results for each individual pesticide reveal a unique pattern of distribution resulting from its primary uses, the distributions of land uses and crops, and the chemical and physical properties of the pesticide.
Do pesticides only occur in agricultural areas? | BACK TO QUESTIONS |
No, pesticides occur in all land-use settings and occur where they are used. In fact, one of the major findings of NAWQA studies is the strong correlation between pesticide occurrence and land use. The most intensive pesticide applications are in agricultural and urban areas. There is substantial use for home, lawn, and garden pest control in residential areas.
How do pesticides differ between agricultural and urban areas? | BACK TO QUESTIONS |
The pesticide compounds detected most frequently in streams and rivers in agricultural and urban areas reflect the pesticides used in those areas. Three herbicides commonly used in urban areas—simazine, prometon, and tebuthiuron—and four commonly used insecticides—diazinon, chlorpyrifos, carbaryl and fipronil—were most frequently detected in the urban streams, often at higher concentrations than in agricultural streams. The most frequently detected herbicides that are used mainly for agriculture—atrazine, metolachlor, and acetochlor—generally were detected most often and at the highest concentrations in water samples from streams in agricultural areas, particularly in the Corn Belt.
Why is understanding pesticide use important? | BACK TO QUESTIONS |
The strong correlations between the levels of pesticides found in agricultural streams with the amounts of agricultural pesticides used can help managers anticipate and prioritize the pesticides most likely to affect water quality. Detailed information on the geographic patterns and trends in the agricultural use of pesticides is available from USGS at: http://water.usgs.gov/nawqa/pnsp/usage/maps/ . However, detailed information on non-agricultural pesticide use is not available.
Do pesticides occur all year long? | BACK TO QUESTIONS |
Pesticide concentrations in stream water vary by season, with lengthy periods of low concentrations punctuated by seasonal pulses of much higher concentrations. For example, in streams that drain farmland throughout most of the Corn Belt, concentrations of herbicides were generally highest during spring runoff following pesticide applications. An effective monitoring strategy for streams may thereby require increased sampling—including high-frequency sampling during seasons when intense pesticide use coincides with periods of high runoff—so that the periods with the highest pesticide concentrations are adequately characterized.
Does pesticide detection automatically mean harmful effects? | BACK TO QUESTIONS |
No. The presence of ‘detectable’ pesticides does not necessarily translate into adverse effects on humans or aquatic ecosystems because detections were often at low concentrations. USGS analytical methods are designed to measure low levels—sometimes parts per trillion—that are well below water-quality benchmarks for most pesticides. By this approach, the assessment helps to identify emerging issues and to track changes in concentrations over time, and it provides a comprehensive screen on the types of pesticides we can expect to see in different settings and areas of the country.
Did USGS do a risk assessment on pesticides? | BACK TO QUESTIONS |
No. The USGS report is NOT a risk assessment study and findings should not be confused with risk assessments for specific pesticides by EPA. However, to place findings in a context for understanding potential effects on human health and aquatic life, measured concentrations by NAWQA were compared to screening level, water-quality benchmarks derived from standards and guidelines established by EPA, toxicity values from EPA pesticide risk assessments, and selected guidelines from other sources. The water-quality benchmarks are estimates of the concentrations below which adverse effects on humans or aquatic life are not expected to occur. The screening-level assessment is primarily intended to identify and prioritize needs for further investigation (see next question).
How did NAWQA assess potential effects? | BACK TO QUESTIONS |
To help place pesticide-occurrence data in a human-health or environmental context, NAWQA assessed potential effects based on comparing measured concentrations to water-quality benchmarks, which are estimates of the concentrations above which pesticides may have adverse effects on humans or aquatic life. This “screening-level” assessment provides an initial perspective on the relevance of pesticide concentrations to human and environmental health, and is intended to identify and prioritize sites and pesticides that may require further investigation. Benchmarks are only indicators and should not be confused with detailed risk and toxicity assessments that are conducted by EPA in determining the safety of pesticides.
All of the aquatic life benchmarks used in the assessment were for chronic exposures because the sampling frequency at these sites was not sufficient to characterize the highest concentrations that may have been present. Most of the benchmarks used in the NAWQA screening-level assessment were derived from standards and guidelines established by EPA, toxicity values from EPA pesticide risk assessments, and selected guidelines from other sources. Most of the water-quality benchmarks are estimates of no-effect levels, such that concentrations below the benchmarks are expected to have a low likelihood of adverse effects. The presence of pesticides in streams at concentrations that exceed benchmarks does not indicate that adverse effects are certain to occur. Conversely, concentrations that are below benchmarks do not guarantee that adverse effects will not occur, but indicate that they are expected to be negligible.
What are the characteristics and limitations of the NAWQA assessment of potential effects? | BACK TO QUESTIONS |
There are several complexities and limitations. The potential for effects on humans or aquatic life may either be under or over estimated by benchmark comparisons in specific situations—the screening-level results are primarily intended to identify and prioritize needs for further investigation.
Were water-quality benchmarks available for all pesticides? | BACK TO QUESTIONS |
One or more Human-Health Benchmarks were available for 70 of the 123 pesticides and degradates analyzed by NAWQA. A total of 78 of the pesticide compounds analyzed by NAWQA in water have one or more chronic aquatic-life benchmarks.
Why do pesticides exceed water-quality benchmarks for aquatic life more often in urban areas than in agricultural areas? | BACK TO QUESTIONS |
Exceedences in urban areas primarily relate to the more frequent presence of insecticides, which can be more toxic to aquatic life than herbicides. The pesticides with the greatest potential to affect urban streams during the study period were diazinon, chlorpyrifos, malathion, dichlorvos, and fipronil. The use of diazinon declined since the end of the 1992-2001 study period. Non-agricultural uses of chlorpyrifos have also been declining because of use restrictions (and the use of other pesticides may be changing as well).
Are concentrations high enough to kill fish? | BACK TO QUESTIONS |
Concentrations of pesticides seldom occurred at levels thought to be chronically toxic to fish (but rather the chronic toxicity applies mostly to invertebrates). Less than 10 percent of urban and agricultural streams had levels of a pesticide that exceeded a chronic benchmark for fish.
What are some examples of pesticide trends in streams? | BACK TO QUESTIONS |
Pesticide concentration trends in streams and rivers were both decreasing and increasing for certain pesticides, showing responses to regulatory actions, reduced use, and the introduction of new pesticides. The following are some examples of pesticide concentration trends seen in streams and rivers:
Metolachlor: Metolachlor is one of the most frequently detected pesticides during both decades in agricultural and mixed-land-use streams. Aquatic-Life Benchmark exceedances declined from 1992-2001 to 2002-2011, reflecting a sharp decline in use during 1998-2001 following the introduction of S-metolachlor, which requires about half the use rate for the same weed control. Consistent with its national use trend, concentration trends were predominantly downward or non-significant in major rivers during 1997-2006. Concentration trends then turned mostly upward during 2001-2010, corresponding to a gradual increase in use. Though use and concentrations increased during this recent decade, concentrations remained lower than for most of the previous decade.
Atrazine: Although atrazine has been one of the most frequently detected pesticides, its concentrations have been low compared to current Aquatic-Life Benchmarks except in a small proportion of agricultural streams. Concentration trends were predominantly downward or non-significant in major rivers during both 1997-2006 and 2001-2010.
Diazinon: Diazinon was frequently detected in urban streams during 1992-2001. Stream concentration trends were downwards in urban streams during both 1996-2004 and 2000-2008, and in major rivers during both 1997-2006 and 2001-2010.
Malathion: Few sites could be tested for malathion concentration trends during either assessment period because of the low frequency of detected concentrations, all testable trends were either downward or non-significant for both urban streams and major rivers.
Chlorpyrifos: Chlorpyrifos was frequently detected in urban streams. Urban stream concentration trends were downwards during both 1996-2004 and 2000-2008, although few trends were testable during 2000-2008 because of the increasingly low frequency of detection. Few major river sites could be tested for concentration trends because of infrequent occurrence.
Carbaryl: Concentration trends were increasingly downward and non-significant during 2000-2008 for carbaryl in urban streams. Most concentration trends in major rivers were downward or nonsignificant during both decades.
Fipronil: Testable trends during 2002-2011 were mostly upward in urban streams and non-significant for major rivers.
What are the next steps and priorities for filling information gaps for pesticides? | BACK TO QUESTIONS |
Pesticides assessed during 1992−2011, which represent somewhat less than half the amount of synthetic organic herbicides, insecticides, and fungicides used for agriculture in the U.S., frequently occurred in streams and rivers and pose continuing and widespread concerns for aquatic life based on benchmark exceedances. The potential for adverse effects is likely greater than these results indicate because a wide range of potentially important pesticide compounds were not included in the assessment. In addition, sampling frequencies in this assessment were not adequate to reliably characterize the highest short-term concentrations. This assessment focused on pesticides dissolved in water, whereas some hydrophobic pesticides, such as legacy organochlorines and pyrethroid insecticides, are important as contaminants of sediment and tissues and should be considered when evaluating stream ecosystems.
Expanded assessment should:
How can NAWQA findings guide monitoring strategies? | BACK TO QUESTIONS |
Improved monitoring of pesticides may require:

![]() U.S. Department of the Interior | U.S. Geological Survey
U.S. Department of the Interior | U.S. Geological Survey
URL: http://water.usgs.gov/nawqa/pnsp/pubs/pest-streams/faq.html
Page Contact Information: gs-w_nawqa_whq@usgs.gov
Page Last Modified: Monday, 29-Sep-2014 13:27:25 EDT
