National Water-Quality Assessment (NAWQA) Project
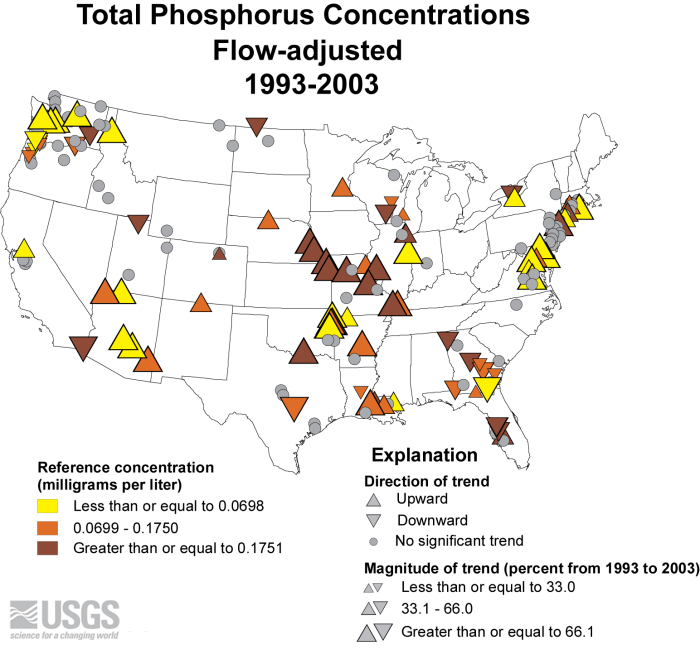
This map illustrates changes over an 11 year period in phosphorus concentrations in streams across the Nation. Increases in phosphorus concentrations, adjusted for streamflow, occurred from 1993 to 2003 in 33 percent of the streams, and decreases were estimated in 16 percent of the 171 streams assessed. Flow adjusted phosphorus concentrations increased by more 50 percent in 26 percent of the streams assessed. Phosphorus concentrations were adjusted for streamflow so that changes in nutrient concentrations could be evaluated in comparison to changes in nutrient sources, such as fertilizer application, animal manure, wastewater discharges, and population.
Information on changes in nutrient concentrations and loads in streams and rivers across the Nation and how these changes correspond to streamflow and nutrient sources can be assessed at: http://water.usgs.gov/nawqa/pubs/nutrient_trends/

![]() U.S. Department of the Interior | U.S. Geological Survey
U.S. Department of the Interior | U.S. Geological Survey
URL: http://water.usgs.gov/nawqa/home_maps/Map-FA-TP.html
Page Contact Information: gs-w_nawqa_whq@usgs.gov
Page Last Modified: Tuesday, 04-Mar-2014 14:43:57 EST
