USGS Groundwater Information
|
USGS Groundwater Information > August 1, 2015 Highlights USGS Monthly Groundwater News and Highlights: August 1, 2015Featured Product: USGS California Drought Web Site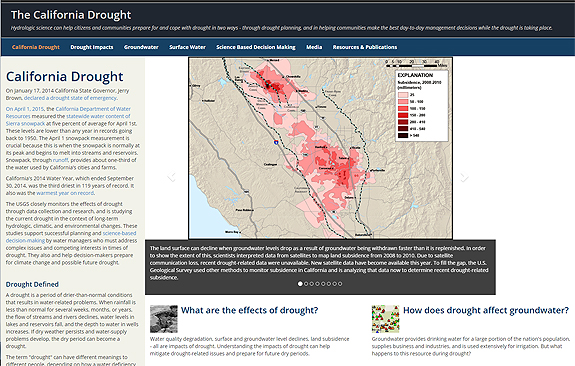
If you've been following the news lately, you've probably heard that California is in the midst of one of the worst droughts in the state's recorded history. (A drought is a period of drier-than-normal conditions that results in water-related problems.) The ongoing drought is affecting water supplies and ecosystems around the state. Declining groundwater levels have resulted in land subsidence (see photos below), and some wells in the Central Valley -- a key agricultural region -- have gone dry. The Governor declared a drought State of Emergency last year, and mandatory water-use restrictions are in place around the state. Scientists from the USGS California Water Science Center are closely monitoring the effects of the California drought through data collection and research around the state. Our hydrologists use the data and information they collect now, combined with historical data and scientific tools such as groundwater models, to improve our understanding of the current drought in the context of long-term hydrologic, climatic, environmental changes, and to forecast future conditions. USGS science is being used by California water managers and policy makers to support successful planning and science-based decision-making to respond to the drought and plan for the future. For the latest USGS science on this important topic, visit the USGS California Water Science Center's drought web site. USGS Groundwater-Related Press Releases 
The USGS Active Groundwater Level Network includes about 20,000 wells that have been measured by the USGS or USGS cooperators at least once within the past 13 months. The animation shows a daily snapshot of water-level statistics in the network for July 2015. Credit: USGS. The image is in the public domain. New Groundwater Model Provides Better Understanding of Edwards Aquifer Drainage of Prairie Pothole Wetlands Can Increase Flooding and Degrade Ecosystems Congressional Hearings, Briefings, and StatementsJuly 31, 2015: Using Every Drop of Information: the Open Water Data Initiative USGS Groundwater-Related PublicationsHydrologic conditions in Rhode Island during water year 2014 Water levels of the Ozark aquifer in northern Arkansas, 2013 Metamodels to bridge the gap between modeling and decision support Geostatistical borehole image-based mapping of karst-carbonate aquifer pores The Effect of modeled recharge distribution on simulated groundwater availability and capture 
Photo taken at National Geodetic Survey vertical control mark W 990 CADWR, West Washington Road near the San Joaquin River, Merced County, California. Photo Credit: USGS/Justin Brandt. The photo is in the public domain. 
Photo taken at National Geodetic Survey vertical control mark H 1235 Reset, Santa Rita Bridge, California State Highway 152, Merced County, California. Photo Credit: USGS/Justin Brandt. The photo is in the public domain. Field Photos:Land subsidence is a gradual settling or sudden sinking of the Earth's surface owing to subsurface movement of earth materials. These photos were taken at two of five benchmark locations used to help measure the largest recent land subsidence in the San Joaquin Valley, California, using repeat surveys. Hydrologist Michelle Sneed is holding signs that indicate how far the ground has settled over the years indicated; the signs also show how the rate of land subsidence at these locations increased in recent years. The exact maximum subsidence location in the region is unknown; however, the 5 benchmark sites have the largest magnitude measured in the last 5 years. The USGS used satellite-based interferometric synthetic aperture radar (InSAR) images to further characterize this large subsidence bowl first seen by California Department of Water Resources surveys northeast of the Delta-Mendota Canal. The InSAR images processed by USGS indicate that this bowl is much larger than originally believed, encompassing roughly 1,200 square miles and includes part of the canal. Centered near the town of El Nido, California, it is bounded roughly by the towns of Merced on the north, Mendota on the south, Los Banos on the west and Madera on the east. It also includes part of the San Joaquin River, most of the Eastside bypass — the primary flood control channel east of the river — and other water conveyance structures. At the center of the subsidence bowl near El Nido (pictured), the rate of subsidence in this area — nearly 1 foot a year — is among the highest ever measured in the San Joaquin Valley. Continued subsidence could cause infrastructure damage in local communities as well as adversely affect the already subsided canal area. (For the detailed study, refer to Sneed and others, 2013) Learn more: USGS California Land Subsidence Monitoring Network Delta-Mendota Canal: Evaluation of Groundwater Conditions & Land Subsidence Overview of land subsidence - USGS national fact sheets and related reports |
![]() U.S. Department of the Interior |
U.S. Geological Survey
U.S. Department of the Interior |
U.S. Geological Survey
URL: http://water.usgs.gov/ogw/highlights/2015-08-01.html
Page Contact Information: Contact the USGS Office of Groundwater
Page Last Modified: Wednesday, 28-Dec-2016 01:36:31 EST
