USGS Groundwater Information
Groundwater Resources Program
![[Photo: Groundwater flowing out of well.]](/ogw/gwrp/images/flowingwell-vsm.jpg)
New & Noteworthy
USGS Groundwater WatchUSGS maintains a network of active wells to provide basic statistics about groundwater levels. ![[Image: USGS active water level wells location map.]](http://groundwaterwatch.usgs.gov/sm_ogw.png "USGS Groundwater Watch")
Other Water TopicsUSGS in Your StateUSGS Water Science Centers are located in each state. ![[Map: There is a USGS Water Science Center office in each State.]](/ogw/images/usmapsmall.gif)
|
Water-Table Fluctuation (WTF) MethodRecharge to Surficial Aquifers in Minnesota based on the WTF Method
There is a relation between unsaturated-zone thickness and estimates of recharge that were based on the WTF method. The data in Figure 2 represent WTF recharge estimates that were based on the graphical approach used in the WTF method for all continuous-measurement wells at the Bemidji, Williams Lake, and Glacial Ridge sites for 2003. A similar relation is evident for other years as well as for the graphical and MRC approaches. There is no relation between recharge estimates and unsaturated-zone thickness for thicknesses greater than about 3.5 m. At shallower depths to the water table, however, the WTF-estimated recharge rate increases. One possible reason for this increase in recharge rate may be that it takes proportionately less time for water to travel through a thinner unsaturated zone, thus bringing the water to the saturated zone before it can be transpired by plants. Another is that the effective Sy decreases with proximity to the water table due to increased water content ( Childs, 1960). Without taking this phenomenon into consideration Sy is overestimated. It should be noted that although a shallow water table at Williams Lake and Glacial Ridge indicates a greater recharge rate, it also implies a greater groundwater ET rate. The relatively shallow depth to the water table is thought to be the cause for some of the anomalously large WTF recharge rates estimated for the Des Moines River site (Fig. 3).
Study results indicate that water-level measurement frequency is important in applying the WTF method. Measurements made less frequently than about once per week resulted in substantially reduced recharge estimates. This result was observed for all WTF recharge estimation approaches and continuous-measurement wells at the Bemidji, Williams Lake, Princeton, Des Moines River, and Glacial Ridge sites. For example, the effects of water-level measurement interval on recharge estimates at Princeton well R2 in 1993 are illustrated in Figure 4. Water levels in this well were measured hourly throughout the year using a datalogger. By successively editing this hourly data set, smaller data sets were generated representing daily, every 3 days, weekly, bi-weekly, and monthly measurements. In using the graphical approach to estimate recharge, there is essentially no change in estimated recharge when reducing the data set from hourly to once daily measurements; there is a 23% underestimation when reducing the data set from hourly to weekly measurements, and a 48% underestimation when reducing the data set from hourly to monthly measurements. Similar results were obtained for the other continuous-measurement wells and for the graphical and MRC approaches to the WTF method.
We hypothesized that if daily water-level measurements for a well were collected during a single year (and accurate WTF recharge estimates were made) that accurate recharge estimates could also be made in future years where only monthly measurements are available by applying an underestimation factor calculated from the single year’s worth of data. This hypothesis was tested by evaluating water-level data from several wells with multiple years of data. The conclusion was that underestimation of WTF recharge due to reduced measurement frequency is not constant from year to year but is variable, depending on climatic factors. Recharge during the summer months in this type of climate typically is minimal, although recharge can occur in the summer months if precipitation, soil moisture, and other factors are favorable. Therefore, results of this study indicate that if the hydrologist or water manager wants an accurate recharge estimate, and needs to quantify these types of (unexpected) recharge events, it would be wise to collect water-level data on at least a weekly (and preferably more frequent) basis throughout the year. Unexpected recharge events simply cannot be quantified if the data have not been collected due to use of a measurement interval less frequent than weekly. Study Conclusions: Of the methods used in this study, the WTF method was the simplest and easiest to apply. Because water-level data are readily available this method could also be considered the least expensive to apply, although results indicate that at least a weekly measurement frequency is required to avoid an unacceptable underestimation of the recharge rate. Of the WTF approaches used, RISE is the most reproducible; any user that applies the program properly should generate exactly the same recharge rate as the next user. With some additional enhancements, the MRC approach could be reproducible in a similar sense as the RISE approach. Recharge estimates on the basis of the MRC approach was consistently greater than recharge estimates made using the graphical and RISE approaches. Of all the WTF approaches, the graphical approach requires the most subjectivity on the part of the user in projecting the groundwater recession curve and thus is the least reproducible. Table 1. Average recharge rates as a percentage of precipitation estimated using the water-table fluctuation method.
*, USGS site where continuous water-level measurements were made; --, insufficient data to estimate recharge; MDNR, Minnesota Department of Natural Resources; MRC, Master recession curve; RISE, A. Rutledge, U.S. Geological Survey, written commun., 2005; NA, Not applicable; Sy, specific yield; Map ref. no., reference number on Figure 6. | ||||||||||||||||||||||||||||||||||||||||||||||||||||||||||||||||||||||||||||||||||||||||||||||||||||||||||||||||||||||||||||||||||||||||||||||||||||||||||||||||||||||||||||||||||||||||||||||||||||||||||||||||||||||||||||||||||||||||||||||||||||||||||||||||||||||||||||||||||||||||||||||||||||||||||||||||||||||||||||||||||||||||||||||||||||||||||||||||||||||||||||||||||||||||||||||||||||||||||||||||||||||||||||||||||||||||||||||||||

![]() U.S. Department of the Interior |
U.S. Geological Survey
U.S. Department of the Interior |
U.S. Geological Survey
URL: http://water.usgs.gov/ogw/gwrp/methods/wtf/surficial_mn.html
Page Contact Information: Contact the Groundwater Resources Program
Page Last Modified: Tuesday, 03-Jan-2017 20:47:03 EST

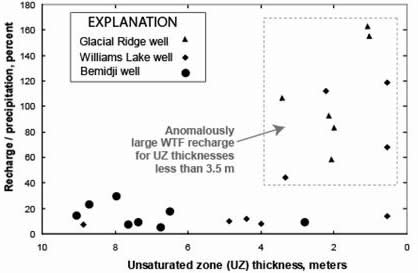
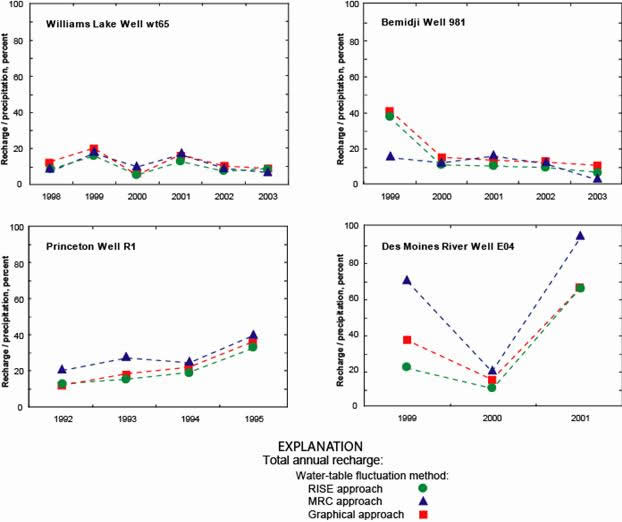
 Figure 4. Effects of measurement frequency on water-table fluctuation (WTF) recharge estimates for Princeton well R2 using three approaches (data from 1993).