USGS Groundwater Information
Groundwater Resources Program
![[Photo: Groundwater flowing out of well.]](/ogw/gwrp/images/flowingwell-vsm.jpg)
New & Noteworthy
USGS Groundwater WatchUSGS maintains a network of active wells to provide basic statistics about groundwater levels. ![[Image: USGS active water level wells location map.]](http://groundwaterwatch.usgs.gov/sm_ogw.png "USGS Groundwater Watch")
Other Water TopicsUSGS in Your StateUSGS Water Science Centers are located in each state. ![[Map: There is a USGS Water Science Center office in each State.]](/ogw/images/usmapsmall.gif)
|
Water-Table Fluctuation (WTF) MethodRecharge to a Fractured Bedrock Aquifer in Pennsylvania (Risser and others, 2005)
Challenges in Fractured Rock --Variability of Dh and Sy
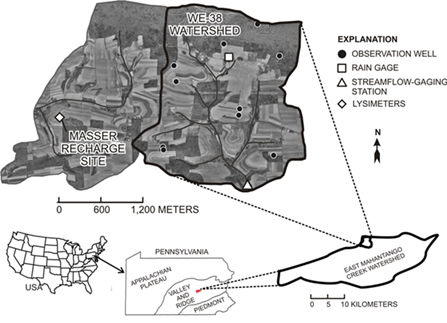
At the WE-38 watershed the variability in estimates of Dh and Sy among wells illustrates the practical difficulties in application of the method in fractured-rock aquifers. For example, the degree to which water levels fluctuate in observation wells varies considerably within the WE-38 watershed as illustrated for several wells (fig. 2). The variability in water-level rise exhibited by these wells is mostly the result of location of the well within the watershed with respect to streams and the degree to which the well is connected to the aquifer through fractures intercepted by the well. For example, the total of all water-level rises during 1999 was 3.4 m for near-stream well 61-D, compared to 38 m for upland well 43-D. This difference occurs because movement of water away from the water table during the period of recharge is rapid near the stream boundary compared to upland settings. Differences in the well/aquifer hydraulic connection is exemplified by wells 36-D and 59-D, which are only 48 m apart and of similar depth and construction, yet water-level fluctuations differ substantially. The importance of the well/aquifer hydraulic connection is most dramatically illustrated by changes in the water-level hydrograph of observation well 45-D following hydraulic testing. In 1992, hydraulic testing of observation wells was conducted by isolating depth intervals with packers and injecting water. After the testing, the magnitude of water-level fluctuations changed in many of the wells. The hydrograph of well 45-D is an example of the most extreme change probably caused by the testing (fig. 3). Most likely, the hydraulic testing acted as a well-development mechanism, causing the well-aquifer connection to improve. An average specific yield of 0.013 was determined by the method of Olmsted and Hely (1962) for the WE-38 watershed from 11 recession periods chosen during the months of October through May when evapotranspiration from ground water was expected to be minimal. This is close to the value of about 0.01 determined by Gburek and Folmar (1999) from water-table rises and lysimeter percolate at the Masser Recharge Site adjacent to the watershed. However, because Sy is so small at this site, small absolute differences in estimates of Sy can cause large relative differences in estimated recharge. For individual wells, the estimated values of apparent Sy differed greatly within the WE-38 watershed -- from 0.0035 to 0.035, which illustrates the possible large variability of this parameter in a fractured-bedrock aquifer.
|

![]() U.S. Department of the Interior |
U.S. Geological Survey
U.S. Department of the Interior |
U.S. Geological Survey
URL: http://water.usgs.gov/ogw/gwrp/methods/wtf/fracrock_pa.html
Page Contact Information: Contact the Groundwater Resources Program
Page Last Modified: Tuesday, 03-Jan-2017 20:46:57 EST