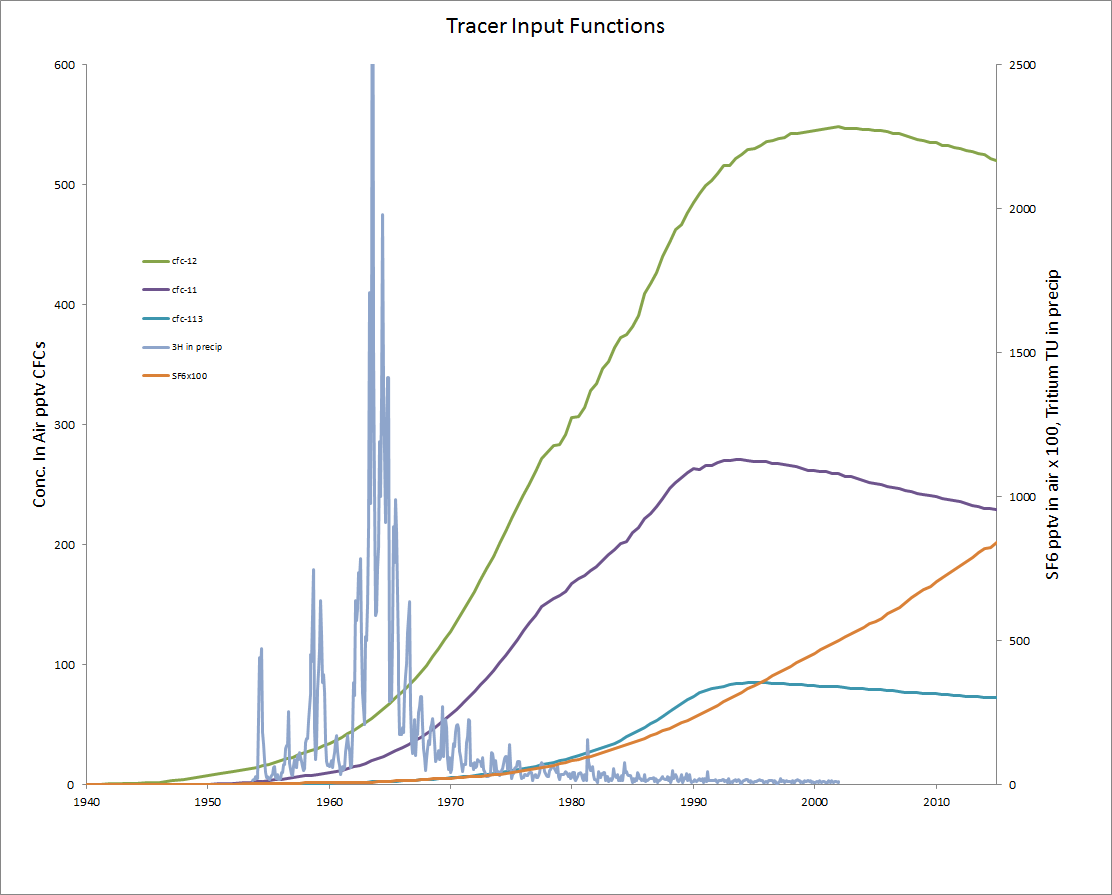
Atmospheric mixing ratios of CFC-11, CFC-12, CFC-113, SF6 x 100, and tritium in precipitation for Northern Hemisphere atmosphere.
Data for the construction of the mixing ratios in this figure were obtained from the CMDL/NOAA website URL http://www.cmdl.noaa.gov/ (Elkins, Butler, Thompson, and Montzka, 2003; Montzka et al., 1996 and 1999), from the CDIAC website URL http://cdiac.esd.ornl.gov/ (Walker et al., 2000; Prinn et al., 2000; Cunnold et al., 1997). Data that was used to construct the Northern Hemisphere 1980 to 1990 atmospheric concentrations for CFC-113 were obtained from a number of sources (Busenberg and Plummer, 1993; Wisegarver and Gammon, 1988; Gilpin, 1991; Wang 1993 and 1997; and Tominaga, 1993). The pre-1980's mixing ratios were reconstructed from production and atmospheric release data (Fisher and Midgley, 1993; and AFEAS, 2003, http://www.afeas.org/ ). The USGS GW Dating Lab Group also maintains an air monitoring station at Shenandoah National Park, VA.
Atmospheric mixing ratios of CFC-11, CFC-12, CFC-113, SF6 and tritium in precipitation in North America (NH) compiled by the USGS GW Dating Lab Group can be downloaded in an excel spreadsheet here.
Air Curves CFCs SF6 3H excel spreadsheet