 Stream Water Quality in the Conterminous United States --
Status and Trends of Selected Indicators During the 1980's
 Stream Water Quality in the Conterminous United States --
Status and Trends of Selected Indicators During the 1980's
Go to Table of Contents
or Go to previous section
Toxic trace elements and pesticides in finfish tissue. -- The FWS NCBP stands as an exception to the lack of national-level information on both the biological and toxicological aspects of water quality. The data base consists of analyses of concentrations of selected toxic trace elements and organic compounds in whole finfish; the fish were collected periodically between calendar years 1970 and 1986 from a national network of 117 stations located on major rivers and in the Great Lakes (113 stations in the conterminous United States). A recent study (Schmitt and Finger, 1987) indicates that trace-element concentrations measured in this program do not generally suffer from the over-estimation problem cited above for dissolved trace elements in water samples (see previous discussion under "Toxic Chemicals"). Although selected results of statistical analyses of data from the program have been published in several articles (Lowe and others, 1985; Schmitt and Brumbaugh, 1990; Schmitt, Zajicek, and Peterman, 1990; and Schmitt, Zajicke, and Ribick, 1985), no comprehensive summary of the findings has been published to date. Collectively, the data provide valuable information on national trends in trace-element, pesticide, and other contaminant concentrations in finfish tissue. In this article, trend information from the NCPB is summarized for four trace elements--arsenic, cadmium, lead, and mercury--and for five organic compounds-- DDT and related compounds, dieldrin, total PCB's, toxaphene, and chlordane and related compounds.
Herbicides in agricultural areas of the Midwest. -- Recent investigations of stream concentrations of herbicides have been completed for a 10-State agricultural region in the Midwest, where a majority of herbicide use in the United States occurs, and for the Mississippi River and its major tributaries that drain this region. Analyses were made of 13 organic compounds (herbicides and their metabolites) in water samples taken from streams throughout the study area during 1989 (samples were taken during March–April, May–June, and October– November) and 1990 (samples were taken during March–April and May–June) (Goolsby, Thurman, and Kolpin, 1991; Thurman and others, 1991). A subsequent study by Goolsby, Coupe, and Markovchick (1991) analyzed five herbicides collected at sites on the Mississippi River and its major tributaries during April–June 1991. Collectively, these studies provide the best-available information on the distribution of herbicides in streams in agricultural areas during preplanting, postplanting, and harvesting periods of the year. Selected results of these investigations for four herbicides--alachlor, atrazine, cyanazine, and simazine--are presented in this article.
Ideally, the best method of obtaining a geographically representative sample of the Nation's streams is through a randomized process of selecting the sample locations. In addition to being statistically unbiased, the uncertainty of statistical estimates based on a random sampling design can be stated explicitly. However, because statistical summarization of national conditions has not been the primary objective of monitoring, national water-quality monitoring networks were not established in this randomized manner. Most existing sampling stations, including those operated by Federal, State, and local governments, purposefully are located to monitor the effects of specific sources of contamination to better understand those effects and to efficiently manage water quality. Although such "targeted" sampling is a logical and necessary component of monitoring programs, it results in an unrepresentative sample of national conditions and thus complicates the problem of statistically describing water-quality conditions.
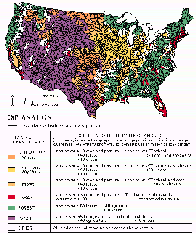
Chemical, physical, and sanitary indicators. -- For the purpose of presenting a national overview of chemical, physical, and sanitary stream water-quality conditions and trends, a geographically representative subset of stations was selected for each indicator from the set of about 1,400 water-quality monitoring stations cited in the section "Indicators" above. A station was selected if it (a) had sufficient data (8 or 10 years) for trend analysis for that indicator (Lanfear and Alexander, 1990), (b) was the most downstream station in a given stream basin, and (c) was not located within 25 miles of any other station. The stream-basin units used in this analysis are USGS hydrologic cataloging units (fig. 37). A cataloging unit is a geographic area representing part or all of a drainage basin, a combination of drainage basins, or a distinct hydrologic feature (Seaber and others, 1987). Because of station-to-station differences in constituents sampled at the water-quality monitoring stations, the number of stations meeting these criteria ranged, for the six constituents used in the national overview of conditions and trends, from 313 to 424.
 Figure 37.
Land-use classification of hydrologic cataloging units, as used in this article, in the conterminous United
States. The classification was derived as follows: agricultural land use by type of land cover and the crops
grown; urban land use by the type ofland cover, population dsnsity, and total surface- and ground-water
withdrawals for domestic use; forest and range land use by type of land cover. For the range land use, the
aggregate land-cover percentages for agriculture, forest, and urban cannot exceed 50 percent. [Sources:
Criteria for determining land use - land cover and crop data from U.S. Soil Conservation Service, 1989, and
K.D. Cavett, U.S. Department of Agriculture, National Agricultural Statistics Service, written communication,
1990; population data from U.S. Bureau of the Census, 1991'; water-withdrawal data from U.S. Geological
Survey files. Hydrologic cataloging units modified from Seaber, 1987.)
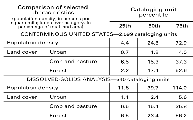
The geographic representativeness of the selected stations was evaluated by comparing land-cover and
population characteristics of the cataloging units containing the selected stations with the same characteristics
collectively for all the cataloging units in the conterminous United States. The comparison for one constituent,
dissolved solids, with the conterminous United States is shown below.

Among the six constituents, the land-cover and population characteristics of the selected cataloging units were virtually identical. Also, the land-cover characteristics of the selected cataloging units closely resemble those for the conterminous United States as a whole, but the population density of the selected cataloging units is slightly higher than for the Nation. Although there are 2,111 cataloging units in the conterminous United States, land-cover data were not available for 3 of the cataloging units; in addition, 9 of the units are lakes that have only water as the land cover. Therefore, all land-cover and population analyses for this article were done on 2,099 cataloging units. The population data are from U.S. Bureau of the Census (1991), and the land-cover data are from K.D. Cavett (U.S. Department of Agriculture, National Agricultural Statistics Service, written commun., 1990) and the U.S. Soil Conservation Service (1989).
Also, to provide a basis for analyzing the chemical, physical, and sanitary indicators by land use in this article, the cataloging units were grouped into four major land uses--agriculture (which is subdivided into wheat, corn and soybeans, and mixed), urban, forest, and range. This land-use classification was based on population density, land-cover characteristics, crop type, and total surface- and ground-water withdrawals for domestic use (fig. 37). Stations in cataloging units not meeting the criteria for any of the land-use classes were not included in these analyses. Note that this land-use classification is unique to this article and does not parallel the land-use classification used in the State summaries in this volume.
Toxic trace elements and pesticides in finfish tissue. -- The stations where finfish were collected by the FWS for analysis are located on the Great Lakes and major rivers of the United States and generally are representative of stream basins larger than about 5,000 square miles. In this article, concentrations data for selected trace element and organic compounds are summarized for the 113 monitoring stations in the conterminous United States and the Great Lakes.
Regional analyses of chemical, physical, and sanitary indicators include comparisons of (a) the concentrations of dissolved oxygen, fecal coliform bacteria, dissolved solids, nitrate, total phosphorus, and suspended sediment in stream basins classified by land use, (b) the load of nitrate, total phosphorus, and suspended sediment transported to reservoirs and coastal waters from large regions and from basins classified by land use, and (c) the concentrations of chloride, sulfate, and hardness and an index of corrosivity (based on pH, temperature, alkalinity, and calcium) in stream basins classified according to domestic, industrial, and irrigation water use. These regional analyses are based on data from one station per cataloging unit from the set of about 1,400 water-quality monitoring stations referred to above in the section "National Analyses." The information on nitrate, total-phosphorus, and suspended-sediment loads is presented for 14 regions compiled from the 18 water-resources regions in the conterminous United States. (For maps showing the 18 water-resources regions, see Seaber and others, 1987, and the "Supplemental Information" part of this volume.) A regional analysis also is presented for herbicide concentrations in a 10-State agricultural region of the Midwest and for herbicide transport for the Mississippi River and its major tributaries.