|
RMA: Top Elevation |
|
RMA: Top Elevation |
The elevation of the top of the aquifer slopes gradually from approximately 71 at the north end of the model to 1 m above the stream at the south end of the model. Color the grid (Data|Color Grid...) with the Model_Top data set. Be sure to click the Apply button. The model elevations of the top of the aquifer will be set by interpolating among several objects. In the north, there will be a straight east-west line with a value of 71. In the south, there will be another copy of the stream with an elevation that will vary along the length of the object. The first step is to tell ModelMuse to interpolate the top elevations.
Select Data|Edit Data Sets... If it isn't already selected, select the Model_Top data set under "Required|Layer Definition." For Interpolation, select Triangle Interp. and click the Apply button.
Triangle Interp. creates a triangulation of the points being interpolated. Then for any location within one of the triangles, it assigns a value using a finite-element basis function. For points outside any of the triangles, it uses the value that would be assigned at the nearest point on the edge of the nearest triangle. At least 3 non-collinear points must be present for Triangle Interp. to be used.
Click the Create straight-line object button  and draw a straight east-west line at the north end of the model. The method of creating the object is the same as was done earlier when defining the model limits. In the Object Properties dialog box, change the name of the object to "Northern Top Elevation Object." Change Number of Z formulas to Zero. Uncheck Set values of intersected cells and check Set values of cells by interpolation. On the Data Sets tab, check the check box for Model_Top and change its formula to 71. Then click OK to close the Object properties dialog box. Because there are only two points in this object, nothing will change yet.
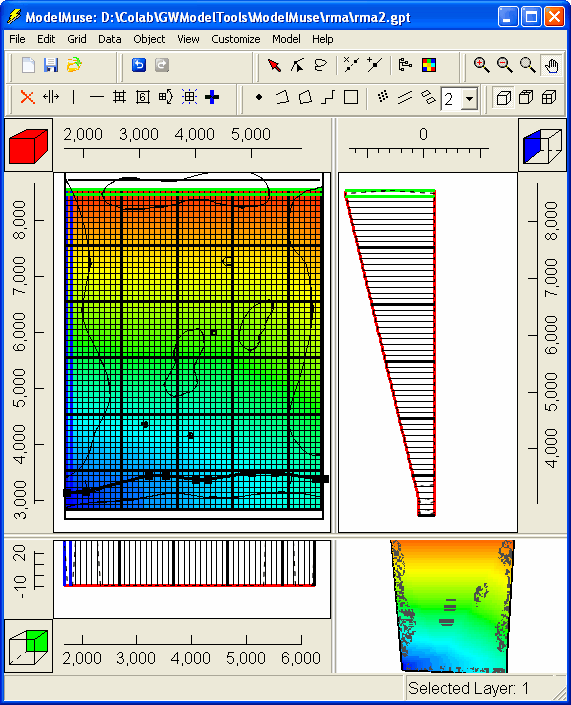
Click on the Create polyline object button  and draw another object in the southern part of the model at the location of the stream. (It may be helpful to stop coloring the grid so that the background image is visible when drawing the stream.) (The previous stream object can not be used for this because it must have two Z formulas and this one will need to have zero Z formulas.) In the Object Properties dialog box, change the name of the object to "Southern Top Elevation Object." Change Number of Z formulas to Zero. Uncheck Set values of intersected cells and check Set values of cells by interpolation. On the Data Sets tab, check the check box for Model_Top and chnge its formula to "Interpolate(FractionOfObjectLength, 5., 0.1, 23.5, 0.9) + 1." Then click OK to close the Object Properties dialog box. Color the grid with the Model_Top data set. This time, the way the grid is colored should change. In addition, the side view of the model will look quite different (fig. 114). If the colors assigned to the cells appear much different from what is shown in figure 114, check that you checked the Set values of objects by interpolation check box. for both the Northern Top Elevation Object and the Southern Top Elevation Object.

Figure 114. Variation in elevation of top of model.