MODFLOW 6 Example: Define Thickness of the Middle Aquifer |
MODFLOW 6 Example: Define Thickness of the Middle Aquifer |
Our next step will be to set up a new data set which we will use to define the thickness of the middle layer. We will define it using interpolation and we will set it up so that the middle aquifer pinches out in the upper right corner of the model. Finally, we will use the new data set to help set the elevations of the rest of the layers.
1.First we need to create a new data set. Select "Data|Edit Data Sets" and click the "Add" button on the bottom left of the Data Sets dialog box. Change the name of the object to "MiddleAquiferThickness" and set its interpolation method to "Triangle Interp." You can leave everything else the same. Click the Apply and Close buttons.
2.Wer're done with the Model_Top_Slope so let's hide it. Click the "Show or hide objects" button  and uncheck the "All Objects" check box to hide all the objects.
3.We also don't need to be coloring the grid so go back to the Data Visualization window and set the data set used to color the grid to "none."
4.We will be creating a whole series of point objects to specify the values of the MiddleAquiferThickness data set. Because this data set will ultimately specify grid elevations, we don't want any of the objects that specify it to be dependent on the grid elevations. Therefore all of them must have zero Z formulas. We can use the "Number of elevations in new objects" combo box to set the number of Z formulas for new objects. Be default, it is set it to "2." Set it to "0."

"Number of elevations in new objects" set to zero.
5.Now click the "Create point object" button  . Then click on the top view of the model to create a point object near the top center of the grid. The Object Properties dialog box will appear immediately. On the Properties tab, uncheck "Set values of intersected cells" and check "Set values of cells by interpolation." Then on the Data Sets tab, set the formula for the MiddleAquiferThickness data set to zero.
6.(Optional) Go to the "Comments/Captions" tab and in the "Caption to appear near object" group of controls, check the "Visible" check box. Set the caption to 0 - the same value we used to specify the value of the MiddleAquiferThickness data set.
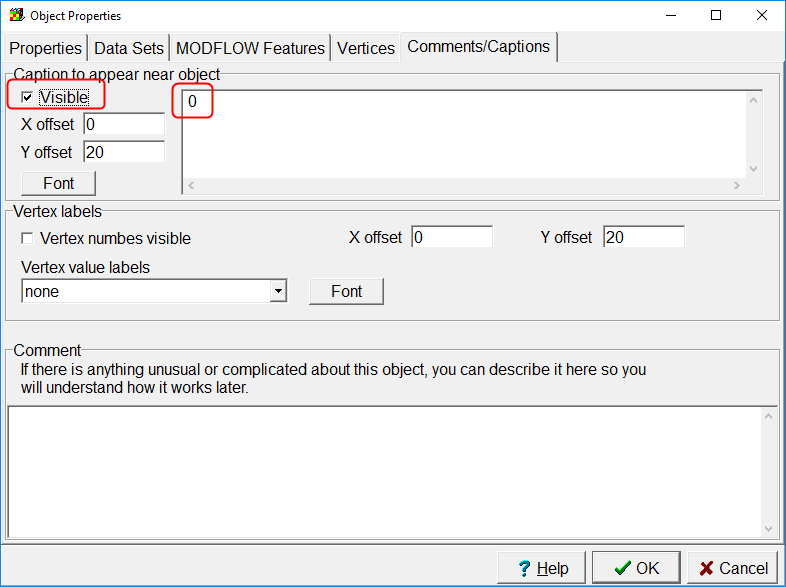
Comments Captions tab with a caption specified.
7.Click the OK button. Note the caption visible near the new point object
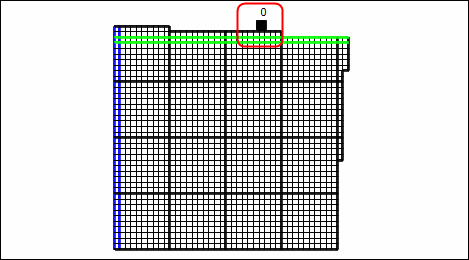
Caption visible near point object
8.Create addition point objects and use all of them the same way to specify the MiddleAquiferThickness data set. It is up to you what thicknesses you want to use but be sure to specify several points that set the MiddleAquiferThickness data set to zero near the upper right corner. Here is one possible distribution of points. (Note, for clarity, only the outline of the active grid cells are shown.)
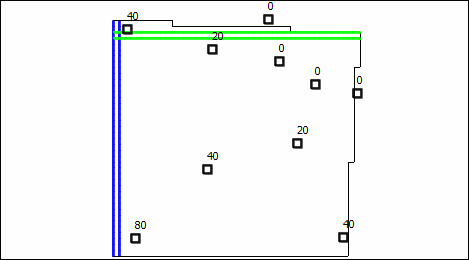
Example distribution of points specifying the thickness of the middle layer.
9.Display the Show or Hide Objects dialog box and check to make sure that the objects specifying the thickness of the MiddleAquiferThickness data set use Interpolation. If not, edit the objects so that they do.
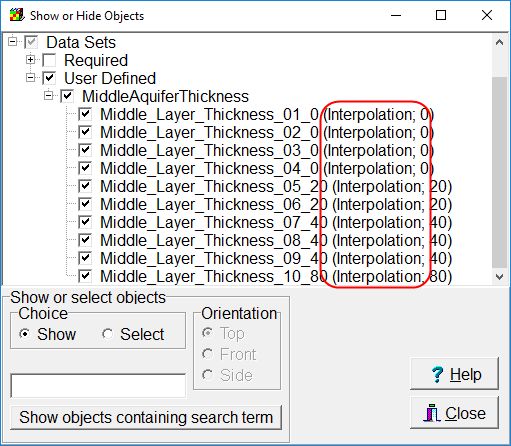
Check that all the objects that set the values of the MiddleAquiferThickness data set do so by interpolation.
10.Now that we have specified the MiddleAquiferThickness data set, we can use it as we set the elevations of the bottoms of the layers. Select "Data|Edit Data Sets" and select each of the data sets that defines the bottom of the layers. Use the following formulas for each data set.
Data Set Name |
Default Formula |
Upper Aquifer Bottom |
Model_Top - 100 |
Middle Aquifer Bottom |
Upper_Aquifer_Bottom - MiddleAquiferThickness |
Lower Aquifer Bottom |
Middle_Aquifer_Bottom - 100. |
11.The middle aquifer pinches out in the upper right corner if you specified the thickness of the middle aquifer similarly to the way shown above. If an inactive cell is vertically between two active cells, MODFLOW 6 can treat it as a vertical pass through cell which means there will be a direct connection between the overlying and underlying active cells. The IDOMAIN data set in MODFLOW will have a value less than zero in vertical pass through cells. ModelMuse has a default formula for the IDOMAIN data set that sets it to -1 for cells in which the layer height is less than or equal to zero and the Active data set is true. We can color the grid with the IDOMAIN data set to visualize the active inactive and vertical pass through cells.
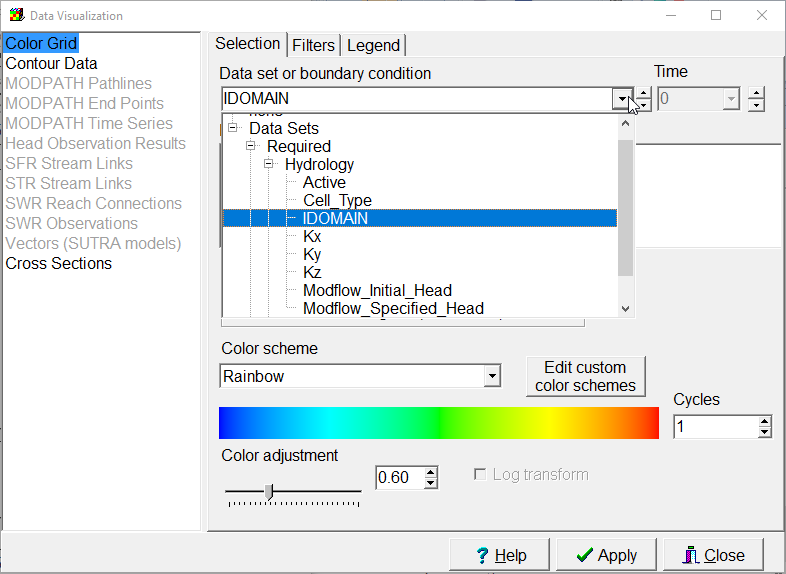
Coloring the grid with the IDOMAIN data set.
12.The only vertical pass through cells are on the middle layer so click on the Model Cube  to select the middle layer. The active cells have a value of 1 (red), the inactive cells have a value of either 0 (green) if they are totally inactive, or -1 (blue) if they are vertical pass through cells.
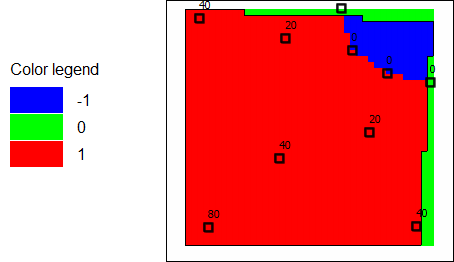
Active (red), inactive (green) and vertical pass through cells (blue)