National Water-Quality Assessment (NAWQA) Project
Go to:
How the table was made:
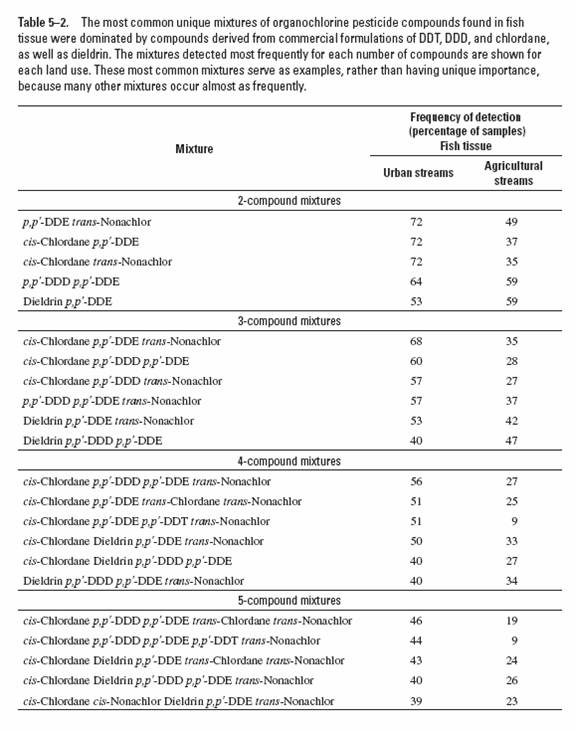
This table shows the three most frequently detected unique pesticide mixtures in whole-fish tissue (percentage of samples) from agricultural or urban areas versus the number of pesticide compounds in the mixtures. Only the 15 most commonly detected pesticide compounds in water (see figure 4-4) were considered when identifying unique mixtures.
A unique mixture is defined in this report as a combination of two or more pesticide compounds, regardless of the presence of other compounds that may occur in the same sample (Squillace and others, 2002, p. 1924-1925). For example, a sample containing compounds A, B, and C contains four unique mixtures—AB, AC, BC, and ABC.
The “total detection frequency” threshold (detections at any concentration—some as low as 0.8 micrograms per kilogram) was used for this table. All 15 of the most commonly detected pesticide compounds in fish tissue can be detected when present at or above 5 micrograms per kilogram (µg/kg) wet weight. (Occasionally, concentrations below these levels may be observed—however, the method cannot reliably (consistently) detect lower concentrations, which may result in underestimation of the number of samples in which these compounds occur at concentrations less than 5 µg/kg.)
Fish samples with raised reporting levels (that is, reported as not detected above a specified concentration that is greater than the 5 µg/kg reporting level, such as <10 µg/kg) are treated as missing data. Missing data for individual pesticide compounds were considered nondetections for the purposes of this figure.
Samples were pooled by land use for analysis. Each site is represented by one whole-fish sample (each a composite of 5–8 individual whole fish of the same species). For each of the two national land-use classes shown in the table:
d! / n! (d – n)!
where n ranges from 2 to d (Walpole and Myers, 1978, p. 13). Then, the total number of unique mixtures in a sample is the sum of the numbers of unique mixtures calculated for each value of n from 2 through d.
The table was prepared by listing the three (or four, if ties) most frequently detected unique mixtures for each value of n (the number of pesticide compounds in the mixture) from 2 through 5, by land-use class. Listing only the three most frequently detected mixtures would result in a table with empty cells for some unique mixtures that were not detected frequently in another land use. Therefore, the empty cells in the table were filled with the calculated frequency of detection for the appropriate mixture and land use. Data in the table are sorted by the number of pesticide compounds in the mixture, the frequency of detection in urban streams, and the frequency of occurrence in agricultural streams. Frequency of detection was rounded to the one’s place for presentation in the table.
References cited:
Squillace, P.J., Scott, J.C., Moran, M.J., Nolan, B.T., and Kolpin, D.W., 2002, VOCs, pesticides, nitrate, and their mixtures in groundwater used for drinking water in the United States: Environmental Science & Technology, v. 36, no. 9, p. 1923-1930.
Walpole, R.E., and Myers, R.H., 1978, Probability and statistics for engineers and scientists (2d ed.): New York, MacMillan, 580 p.
Pesticide names and analytical reporting levels are presented in Appendix 1.
Information on sampling sites and their characteristics is presented in Appendix 5.
Downloadable concentration data are presented in Appendix 6.
Additional information on analytical approach is presented in Appendix 8.
For more information, contact:
Calculation of unique mixtures:
Jonathon C. Scott
U.S. Geological Survey
202 NW 66 th Street , Building 7
Oklahoma City , OK 73116
voice: (405) 810-4415
fax: (405) 843-7712
email: jon@usgs.gov
Pesticides in whole-fish tissue:
Lisa H. Nowell
U.S. Geological Survey
NAWQA Pesticide Synthesis Project
Placer Hall
6000 J Street
Sacramento, CA 95819-6129
voice: (916) 278-3096
fax: (916) 278-3070
email: lhnowell@usgs.gov

![]() U.S. Department of the Interior | U.S. Geological Survey
U.S. Department of the Interior | U.S. Geological Survey
URL: http://water.usgs.gov/nawqa/pnsp/pubs/circ1291/table_5_02.html
Page Contact Information: gs-w_nawqa_whq@usgs.gov
Page Last Modified: Tuesday, 04-Mar-2014 14:44:24 EST
