National Water-Quality Assessment (NAWQA) Project
Go to:
How this table was made:
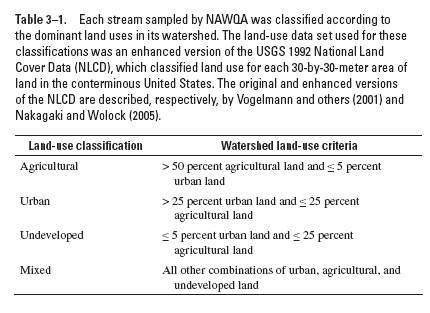
This table defines the national land-use classifications used to characterize stream sites sampled by NAWQA. The objective was to establish a consistent approach for national analysis. Briefly, the percentage of land area within each watershed comprised by up to 25 different land-cover types was determined using national land-cover data. The total agricultural land, total urban land, and total undeveloped land were calculated (as a percentage of total watershed area) by summing the percentages of land cover classifications fitting each of these three categories. Each site then was assigned to one of 4 national land-use classes (agricultural, urban, undeveloped, and mixed land use), depending on the amount of agricultural, urban, and undeveloped land within the watershed, using the criteria listed in this table. Ultimately, a few sites had their classifications adjusted if the land use area percentages within the watershed were substantially different from the sources of water at the stream sampling site. More detail is provided below:
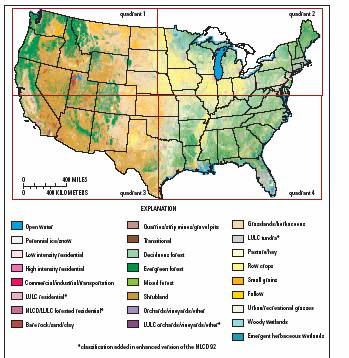
Figure A: The above map shows the “enhanced” 30-m resolution National Land Cover Data 1992 (NLCDe) for the conterminous U.S., including boundaries of the four quadrant grids. Because of limitations of the ArcInfo GRID data model, four separate quadrant grids, rather than a single grid, were generated. (From Nakagaki and Wolock, 2005).
References cited:
Fegeas, R.G., Claire, R.W., Guptill, S.C., Anderson, K.E., and Hallam, C.A., 1983, Land use and land cover digital data: U.S. Geological Survey Circular 895-E, 21 p.
Nakagaki, Naomi, and Wolock, D.M., 2005, Estimation of agricultural pesticide use in drainage basins using land cover maps and county pesticide data: U.S. Geological Survey Open-File Report 2005-1188.
Price, C.V.; Nakagaki, Naomi; Hitt, K.J.; and Clawges, R.M.; 2003, Mining GIRAS—improving on a national treasure of land use data, in Proceedings of the 23rd ESRI International Users Conference, July 7–11, 2003: Redlands, Calif.
U.S. Geological Survey, 1998, Land use and land cover digital data from 1:250,000- and 1:100,000-scale maps.
U.S. Geological Survey, 1999, National land cover digital data.
Vogelmann, J.E.; Howard, S.M.; Yang, Limin; Larson, C.R.; Wylie, B.K.; and Van Driel, Nick; 2001, Completion of the 1990’s national land cover dataset for the conterminous United States from Landsat Thematic Mapper data and ancillary data sources: Photogrammetric Engineering and Remote Sensing, v. 67, p. 650–662.
Information on sampling sites and their characteristics (including land use) is presented in Appendix 5.
For more information, contact:
National land use classification criteria:
Lisa H. Nowell
U.S. Geological Survey
NAWQA Pesticide Synthesis Project
Placer Hall
6000 J Street
Sacramento , CA 95819-6129
voice: (916) 278-3096
fax: (916) 278-3070
email: lhnowell@usgs.gov
Land cover data and processing:
Naomi Nakagaki
U.S. Geological Survey
NAWQA Pesticide Synthesis Project
Placer Hall
6000 J Street
Sacramento, CA 95819-6129
voice: (916) 278-3092
fax: (916) 278-3070
email: nakagaki@usgs.gov

![]() U.S. Department of the Interior | U.S. Geological Survey
U.S. Department of the Interior | U.S. Geological Survey
URL: http://water.usgs.gov/nawqa/pnsp/pubs/circ1291/table_3_01.html
Page Contact Information: gs-w_nawqa_whq@usgs.gov
Page Last Modified: Tuesday, 04-Mar-2014 14:44:24 EST
