National Water-Quality Assessment (NAWQA) Project
Go to:
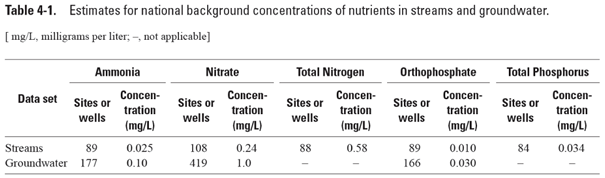
Chapter 4: Occurrence and Distribution of Nutrients in Streams and Groundwater
How this table was made:
This table shows the estimated national background concentrations of nutrients in streams and groundwater.
Streams:
Estimates of background concentrations in surface water were based on data from 51 NAWQA sites (Mueller and Spahr, 2005) plus 59 sites from other networks used in the analysis by Clark and others (2000).
Criteria used to select the sites were:
1. The upstream basin had less than 5 percent urban area and less than 25 percent agricultural area,
2. The site was classified as a reference, forest indicator, or rangeland indicator site by local experts,
3. The basin area was less than 3,000 square kilometers,
4. Data were sufficient for estimation of flow-weighted mean annual nutrient concentrations, and
5. If two sites were on the same stream, only the upstream site was included.
Flow-weighted mean annual concentrations of five nutrient constituents at these 110 sites were computed on the basis of several years of samples (see Mueller and Spahr, 2005, for details). Background concentrations were estimated as the 75th percentile of the flow-weighted means for all sites that had adequate data for each constituent. Selection of the 75th percentile to represent background implies that these concentrations are exceeded at no more than 25 percent of minimally impacted streams and aquifers.
Groundwater:
Background concentrations were estimated using 419 wells: 401 wells from Nolan and Hitt (2003) supplemented with 18 NAWQA wells sampled during 1999-2001. NAWQA data were retrieved from the NAWQA internal Data Warehouse (DWH). The DWH is accessible publicly at http://water.usgs.gov/nawqa/data.
Nolan and Hitt (2003) described nutrient concentrations in shallow groundwater beneath relatively undeveloped areas to determine background concentrations relative to agricultural and urban land. The study looked at 1,880 NAWQA wells sampled during 1993-1998 in 46 NAWQA study units and a retrospective data set consisting of more than 10,000 wells sampled during 1970-92 (Mueller and others, 1995, and U.S. Geological Survey, 2009). Selecting the NAWQA and retrospective wells for those in undeveloped areas produced two data subsets representing 81 NAWQA wells and 320 retrospective wells. For the current analysis, the two data subsets were combined and 5,101 NAWQA wells analyzed for the national assessment of nutrients were screened using sampling date and the criteria used by Nolan and Hitt (2003) to obtain additional NAWQA wells sampled after 1998. The selection produced 18 more wells to augment the data subsets analyzed by Nolan and Hitt (2003).
Criteria, based on land use within 500-meter radius of well, used to select relatively undeveloped groundwater sites were:
1. 67 percent or greater forest or rangeland,
2. 10 percent or less agricultural land, and
3. 10 percent or less urban land.
The wells were selected using historical U.S. Geological Survey Land Use and Land Cover (LULC) modified with new residential land derived from 1990 population density as described in Hitt (2005). Land use was determined for a 500-meter radius representing the recharge area for shallow, low-volume wells pumping recently recharged groundwater.
Background concentrations were estimated as the 75th percentile of a single representative sample from each of the 419 wells that had data for each of three nutrient constituents. Only the dissolved constituents were included because particulate nitrogen and phosphorus are typically negligible in groundwater.
Supplemental information on the retrospective database (U.S. Geological Survey, 2009):
The retrospective database includes over 10,000 ground-water samples and over 22,000 surface-water samples. The ground-water data are for samples collected during 1970-92 from wells that best represented land uses in the Study Units. These data are supplemented by data from the Delmarva Peninsula NAWQA pilot study and the USGS Toxic-Substances Hydrology Program.
Sampling dates at groundwater sites were reported in a variety of formats. Year of sampling is included in the retrospective database because it was reported most often by the various Study Units. Year of sampling also is convenient because some Study Units reported median constituent concentrations. If sampling date ranges for median values fell within a single year, then year of sampling was retained in the national data set for that sample.
Because sampling, preservation, and analytical techniques associated with these historical data changed during the period of record and are different for different agencies, reported nutrient concentrations were aggregated into the following groups: (1) ammonia as N, (2) nitrate as N, (3) total nitrogen, (4) orthophosphate as P, and (5) total phosphorus. For example, ammonia includes both ammonium ions and un-ionized ammonia. More information on methods used to aggregate constituent data is available in the report by Mueller and others (1995).
Ground-water nitrate concentrations below the method detection limit were reported in one of three ways, depending on the source of the data. Values below the detection limit either were set to zero, set equal to the detection limit, or set to one-half the detection limit.
References cited:
Clark, G.M., Mueller, D.K., and Mast, M.A., 2000, Nutrient concentrations and yields in undeveloped stream basins of the United States: Journal of American Water Resources Association, v. 36, no. 4, p. 849–860. (Also available at http://water.usgs.gov/nawqa/nutrients/pubs/awra_v36_no4/.)
Hitt, K.J., 2005, 1970's Land use data refined with 1990 population data to indicate new residential development for the conterminous United States, digital data, accessed 2006, at http://water.usgs.gov/lookup/getspatial?newlu90g.
Mueller, D.K., Hamilton, P.A., Helsel, D.R., Hitt, K.R., and Ruddy, B.C., 1995, Nutrients in ground water and surface water of the United States---An analysis of data through 1992: U.S. Geological Survey Water-Resources Investigations Report 95-431.
Mueller, D.K., and Spahr, N.E., 2005, Water-quality, streamflow, and ancillary data for nutrients in streams and rivers across the nation, 1992–2001: U.S. Geological Survey Data Series 152, accessed January 2007, at http://pubs.usgs.gov/ds/2005/152/.
Nolan, B.T., and Hitt, K.J., 2003, Nutrients in shallow ground waters beneath relatively undeveloped areas in the conterminous United States: U.S. Geological Survey Water-Resources Investigations Report 02-4289, 17 p., accessed April 2007, at http://pubs.usgs.gov/wri/wri024289/.
U.S. Geological Survey, 2009, Nutrients National Synthesis Project, Retrospective Database for Nutrients in Ground Water and Surface Water, last updated: October 20, 2009. Available at http://water.usgs.gov/nawqa/nutrients/datasets/retrodata.html.
Data in figure:
Fig_4-01_table_4-01_swdata.xls.
Fig_4-01_table_4-01_gwdata.txt. See Mueller and others (1995) and U.S. Geological Survey (2009) for more information on the groundwater retrospective data. Values below the detection limit incorporated from the groundwater retrospective data set have been presented as reported in U.S. Geological Survey (2009).
For more information contact:
Stream sites:
Norman E. Spahr, NAWQA Nutrient Synthesis
U.S. Geological Survey
Box 25046, MS 415
Denver Federal Center
Lakewood, Colorado 80225
Voice: 303-236-6920
FAX: 303-236-4912
Email: nspahr@usgs.gov
Groundwater sites:
Bernard T. Nolan, NAWQA Nutrient Synthesis
U.S. Geological Survey
12201 Sunrise Valley Drive
Mail Stop 413
Reston, Virginia 20192
Voice: 703-648-5666
Fax: 703-648-6693
Email: btnolan@usgs.gov

![]() U.S. Department of the Interior | U.S. Geological Survey
U.S. Department of the Interior | U.S. Geological Survey
URL: http://water.usgs.gov/nawqa/nutrients/pubs/circ1350/table_4_01.html
Page Contact Information: gs-w_nawqa_whq@usgs.gov
Page Last Modified: Tuesday, 04-Mar-2014 14:44:08 EST
