
National Water-Quality Assessment (NAWQA) (public)
National Analysis of Trace Elements (public)
Trace Element National Synthesis internal homepage
Dennis A. Wentz, Jennifer L. Morace, and Sarah J. Ryker--November 17, 1999
Information from 1991 and 1994 NAWQA Study Units reveals the following major findings.
Radon is a colorless, odorless, radioactive gas that forms naturally in rocks and soils as a intermediate product in the radioactive decay of uranium-238 to stable lead-206. Radon-222, with a half-life of 3.8 days, is the primary radon isotope of importance in the hydrologic environment (Hem, 1985; A.H. Welch, U.S. Geological Survey, written commun., 1999); it is the direct result of decay of radium-226. Radon, in turn, produces polonium-218 by alpha emission.
All rocks contain some uranium, though most have concentrations on the order of only 1-3 µg/g (Otton et al., 1993). Light-colored volcanic rocks, granites, dark shales, phosphatic sedimentary rocks (and the metamorphic equivalents of any of these rocks) may have uranium concentrations greater than 100 µg/g. Ground water in contact with such rocks, or with sediment derived from them, may have elevated concentrations of radon. Surface water typically has low radon concentrations because aeration causes radon gas to escape to the atmosphere.
The movement of radon through soil is controlled by moisture, porosity, and permeability (Otton et al., 1993). Radon travels shorter distances in wet soils than in dry soils because radon moves slower in water than in air. It moves more easily through highly permeable soils, such as sand and gravel, than through less permeable clay and bedrock. Radon can enter homes from soil or bedrock through cracks in basements or foundations, or it can be released from water during bathing, showering, or cooking.
Breathing radon in indoor air is the second leading cause of lung cancer after cigarette smoking (U.S. Environmental Protection Agency, rev. February 23, 1998). The high-energy alpha particles produced by radioactive decay of radon and its daughter products cause cancer by producing chromosomal DNA damage. An estimated 19,000 lung cancer deaths in 1998 are attributable to radon and the combination of radon and smoking (National Research Council, 1999). Relative to radon in indoor air, radon dissolved in water presents a smaller health risk, either from ingesting water with high radon concentrations or from inhaling radon gas released to the air during bathing, showering, or cooking. An estimated 160 lung cancer deaths in 1998 are attributable to breathing radon released from household water; only 20 stomach cancer deaths are attributable to ingesting radon in drinking water (compared to nearly 14,000 from all causes) during 1998 (National Research Council, 1999).
Based in part on a a risk assessment of radon in drinking water by the National Academy of Sciences (National Research Council, 1999), the U.S. Environmental Protection Agency (USEPA) has proposed a Maximum Contaminant Level (MCL) of 300 pCi/L and an Alternative Maximum Contaminant Level (AMCL) of 4,000 pCi/L for radon in drinking water (U.S. Environmental Protection Agency, rev. October 18, 1999). The final values are to be published by August 2000. The AMCL was determined as the radon concentration in water needed to produce--by activities, such as bathing, showering, and cooking--a value in air equal to the average radon concentration in ambient air (about 4 pCi/L). The AMCL will apply only to states and/or community water systems (CWSs) that develop multimedia mitigation programs to address radon levels in indoor air, the primary cause for concern with regard to radon. States and/or CWSs that do not develop multimedia mitigation programs will be required to meet the MCL. An evaluation of radon in ground water supply systems for the USEPA by ICF Kaiser International Consulting Group (1998) indicates that about 44% of systems are expected to have radon concentrations (annual mean of quarterly duplicate samples) in excess of 300 pCi/L, whereas only 4% are expected to exceed 4,000 pCi/L.
Radon was analyzed in ground water in 19 of the 20 NAWQA Study Units that were initiated in 1991. (Radon was not analyzed in the Trinity River Basin, Texas.) About one-half of the ground water samples were from wells tapping drinking water aquifers. Radon was detected at an overall detection rate of 99 percent. Reported concentrations ranged from 7 to 40,000 pCi/L, with an average value of 920 pCi/L (n=1,758). Median concentrations ranged from 200 pCi/L in the ACFB Study Unit to 1,300 pCi/L in the CONN Study Unit; the median Study Unit concentration was 420 pCi/L.
When ranked by the 75th percentile radon concentrations, the CONN, GAFL, LSUS, POTO, and SPLT Study Units stood apart from the other 1991 Study Units (see Data Summary section below). Similar results were obtained for the 90th percentile concentrations. Radon concentrations in the CONN, LSUS, and POTO Study Units are influenced mainly by uranium-rich igneous and metamorphic rocks of granitic composition (Otton et al. 1993; Lindsey and Ator, 1996; Grady and Mullaney, 1998). Phosphatic rocks in Florida are high in associated uranium and most likely account for elevated concentrations in the GAFL Study Unit (Otton et al. 1993). Granitic crystalline and metamorphic rocks in the mountains of the SPLT Study Unit are high in uranium and contribute to high radon concentrations in this area.
The Study Units with the lowest radon concentrations include the ALBE, CNBR, REDN, and WILL. Part of the ALBE is located in the Outer Atlantic and Gulf Coastal Plain, an area of unconsolidated sands, silts, and clays with one of the lowest radon potentials in the Nation (Otton et al. 1993). The CNBR Study Unit contains the Nebraska Sand Hills, where lighter quartz sands near the surface have been separated from the clay and heavier minerals that usually contain uranium. Pleistocene glacial deposits in the REDN Study Unit have low surficial uranium concentrations, as do the alluvial deposits in the WILL Study Unit.
Sixty-nine percent of samples from 1991 Study Units exceeded the proposed MCL of 300 pCi/L, with exceedances recorded in all 19 Study Units. Exceedances of the proposed AMCL of 4,000 pCi/L occurred in 3% of all samples; exceedances were noted in 10 Study Units and closely mirrored the distribution of the 90th percentile concentrations. The largest number of exceedances were measured in the CONN (23%), SPLT (14%), LSUS (6.6%), and GAFL (6.5%) Study Units. Exceedances for all other Study Units were less than or equal to 3.0%.
Radon in ground water was analyzed for all 16 Study Units that began in 1994. When ranked by either the 75th or 90th percentile concentrations, the KANA, LINJ, SANT, and UCOL Study Units exhibited the highest radon values. It is likely that the geological sources for the KANA, LINJ, and SANT Study Units are similar to those for the CONN, LSUS, and POTO Study Units, whereas sources for the UCOL probably are similar to those for the SPLT.
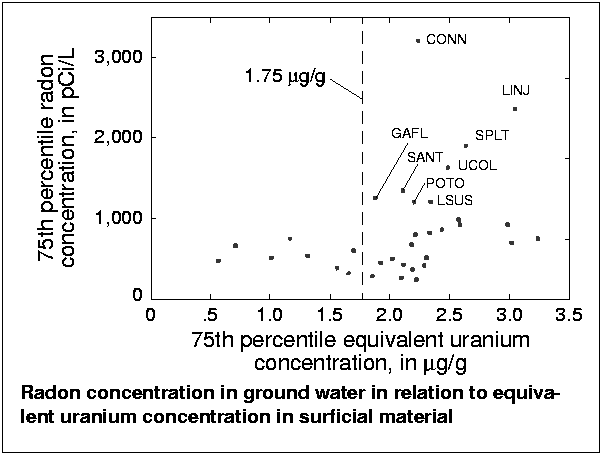 Except for the SPLT and UCOL Study Units, which drain the Colorado Rockies, the highest radon concentrations in ground water were from Study Units in the eastern United States. A nationwide distribution of equivalent uranium concentrations in surficial material (Phillips et al., 1993) was evaluated to determine if these data correlated with radon concentrations. The figure on p. 3 shows that the 75th percentile radon concentrations in ground water were consistently low when the 75th percentile equivalent uranium concentration in surficial material was less than about 1.75 µg/g. At equivalent uranium concentrations greater than 1.75 µg/g, radon concentrations were considerably more variable, and many values were high. Some of the increased variability probably occurs because the equivalent uranium signal was derived from aerial gamma-ray measurements of the top 20-25 cm of surficial material, whereas NAWQA ground water samples were from greater, more variable, depths. Similar results were obtained when median, 90th percentile, and maximum radon concentrations were plotted against 75th percentile equivalent uranium concentrations. Thus, the nationwide distribution of equivalent uranium concentrations can be used to determine which Study Units are not expected to have high radon concentrations in ground water.
Four categories of Study Units are shown on this map:
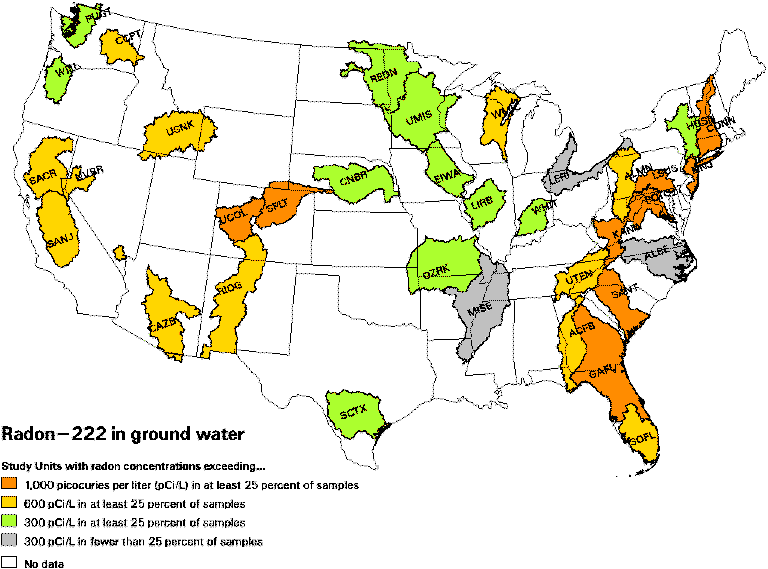 (25 Kb)
Also available as a 590 Kb PostScript file-- landscape or portrait
In this table, Study Units are ranked in descending order, by the 75th percentile of Rn-222 concentrations in NAWQA GW samples.
                (NAWQA ground-           (GD radiometric data on
                 water data)              equivalent uranium in
  SU                                      surficial materials)
 RANK SUID   75th percentile(Rn), pCi/L  75th percentile(U), ug/g
 ---- ----   --------------------------  ------------------------
   1  conn          3200                           2.239
   2  linj          2357                           3.045
   3  splt          1900                           2.637
   4  ucol          1631                           2.487
   5  kana          1492                         no data
   6  sant          1344                           2.109
   7  gafl          1250                           1.882
   8  lsus          1200                           2.34
   9  poto          1200                           2.203
  10  riog           985                           2.571
  11  nvbr           920                           2.584
  12  sanj           919                           2.982
  13  almn           860                           2.436
  14  uten           819                           2.331
  15  acfb           800                           2.218
  16  cazb           749                           3.236
  17  wmic           740                           1.167
  18  usnk           695                           3.014
  19  ccpt           671                           2.178
  20  sofl           661                           0.714
  21  sacr           600                           1.698
  22  umis           530                           1.311
  23  whit           510                           2.309
  24  will           506                           1.015
  25  eiwa           495                           2.026
  26  pugt           470                           0.571
  27  ozrk           443                           1.922
  28  lirb           418                           2.115
  29  hdsn           410                           2.289
  30  redn           383                           1.56
  31  cnbr           365                           2.19
  32  sctx           318                           1.659
  33  albe           280                           1.859
  34  mise           260                           2.1
  35  leri           239                           2.226
      trin       no data                           1.513
 ---- ----   --------------------------  ------------------------
 RANK SUID   75th percentile(Rn), pCi/L  75th percentile(U), ug/g
Grady, S.J., and Mullaney, J.R., 1998, Natural and human factors affecting shallow water quality in surficial aquifers in the Connecticut, Housatonic, and Thames River Basins: U.S. Geological Survey, Water-Resources Investigations Report 98-4042, 81 p.
Hem, J.D., 1985, Study and interpretation of the chemical characteristics of natural water, 3rd ed.: U.S. Geological Survey, Water-Supply Paper 2254, 263 p, 3 pl.
ICF Kaiser International Consulting Group, 1998, Re-evaluation of radon occurrence in groundwater supplies in the United States: prepared for U.S. Environmental Protection Agency, Office of Groundwater and Drinking Water, EPA Contract No. 68-C7-0005 [variously paged]
Lindsey, B.D., and Ator, S.W., 1996, Radon in ground water of the Lower Susquehanna and Potomac River Basins: U.S. Geological Survey Water-Resources Investigations Report 96-4156, accessed October 7, 1999, at URL http://wwwpah2o.er.usgs.gov/reports/wrir_96-4156/report.html
National Research Council, 1999, Risk assessment of radon in drinking water--Executive summary: Washington, D.C., National Academy Press, accessed October 7, 1999, at URL http://www.nap.edu/readingroom/books/radon/
Otton, J.K., Gundersen, L.C.S., and Schumann, R.R., 1993, The geology of radon: U.S. Geological Survey, General Interest Publication, 29 p. (URL http://energy.cr.usgs.gov/radon/georadon.html)
Phillips, J.D., Duval, J.S., and Ambrosiak, R.A., 1993, National geophysical data grids--Gamma-ray, magnetic, and topographic data for the conterminous United States: U.S. Geological Survey Digital Data Series DDS-9, accessed October 12, 1999, at URL http://energy.cr.usgs.gov/radon/DDS-9.html
U.S. Environmental Protection Agency, rev. February 23, 1998, Biological effects of ionizing radiation (BEIR) VI report, "The health effects of exposure to indoor radon"--Executive summary: accessed November 9, 1999, at URL http://www.epa.gov/iaq/radon/beirvi.html
U.S. Environmental Protection Agency, rev. October 18, 1999, Proposed radon in drinking water rule: U.S. Environmental Protection Agency report EPA 815-F-99-006: accessed November 11, 1999, at URL http://www.epa.gov/OGWDW/radon/fact.html
Trace Element National Synthesis internal homepage
National Analysis of Trace Elements (public)
National Water-Quality Assessment (NAWQA) (public)
This page is water.usgs.gov/nawqa-only/trace/summary/radon_nov99.html
Email comments/questions to traceweb@usgs.gov
Last modified: 19Nov1999