
National Water-Quality Assessment (NAWQA) (public)
National Analysis of Trace Elements (public)
Trace Element National Synthesis internal homepage
Dennis A. Wentz -- August 3, 1999
National rankings of sites by selected trace elements in sediment have been added at the end of this page.
Information from 1991 NAWQA Study Unit summary reports and several nationally focused publications reveals the following major findings.
At least nine trace elements (As, Cd, Cr, Cu, Pb, Hg, Ni, Se, and Zn) analyzed in bed sediment from streams, lakes, and reservoirs of 1991 NAWQA Study Units are considered to be toxic to aquatic organisms and to have well-established anthropogenic sources (Rice, 1999). These nine trace elements are the focus of this paper.
Information from 1991 Study Unit summary reports indicates that urbanization was the primary cause of elevated trace element concentrations in bed sediment in at least 12 of the 1991 Study Units . Trace elements reported as being associated with urbanization were (number of Study Units in parentheses): Pb (11); Zn (9); Hg (6); Cd (4); Cr (4); Cu (3); Ni (2); As (1). In addition, the WILL Study Unit reported elevated Ag concentrations in urban basins.
The nine trace elements of interest have known industrial uses, and they can be found in municipal sewage sludge (Rice, 1999). Thus, point sources can be important contributors of trace elements to bed sediment in specific basins (ALBE and POTO). Combustion of fossil fuels and solid wastes can elevate airborne trace element concentrations and can contribute to nonpoint source loads in urban basins (ACFB) or to elevated background concentrations in undisturbed watersheds (GAFL). It follows that large basins with mixed land use are likely to have high trace element concentrations in bed sediment if they include important urban areas, point sources, or nearby atmospheric sources (ACFB, CONN, HDSN, WMIC).
A number of Study Units reported quantitative relationships between trace element concentrations in bed sediment and some measure of urbanization:
Rice (1999) provided the first integrated evaluation of the nine trace elements of interest in bed sediment from 1991 Study Units. A total of 541 samples were included in her analysis.
Several Study Units compared trace element concentrations in bed sediment to guidelines for protection of aquatic life; however, the approach was inconsistent because different States use different guidelines, and no guidance had been provided with regard to a preferred set of guidelines. The Canadian government recently has published updated sediment quality guidelines (SQGs) for bulk sediment samples (Canadian Council of Ministers of the Environment, 1999 1). These guidelines provide a consistent and current reference for evaluating effects on aquatic life. Seven of the nine trace elements of interest (As, Cd, Cr, Cu, Pb, Hg, and Zn) have published SQGs. For the 1991 NAWQA data set, one or more of the 7 trace elements with Canadian SQGs exceeded the Probable Effects Level at 45 of 91 urban indicator sites (49%) and at 176 of 541 sites overall (33%) (Rice, 1999).
Although urbanization was the primary cause of elevated trace element concentrations in bed sediment of 1991 Study Units, natural geologic sources and sources related to mining and agriculture also were identified in some Study Units.
A NAWQA study to investigate the utility of lake and reservoir sediment cores for evaluating historical trends in trace elements has been underway since 1992 (P.C. VanMetre and E. Calendar, written commun., April 2, 1997). At least three 1991 Study Units participated in this study. Results for two Study Units corroborate the association of urbanization and elevated trace element concentrations in bed sediment.
Canadian Council of Ministers of the Environment, 1999, Canadian sediment quality guidelines for the protection of aquatic life--Summary tables: In Canadian environmental quality guidelines, 1999, Canadian Council of Ministers of the Environment, Winnipeg (http://www.ec.gc.ca/ceqg-rcqe/sediment.htm).
Rice, K.C., 1999, Trace-element concentrations in streambed sediment across the conterminous United States: Environmental Science & Technology, v. 33, no. 15, p. 2499-2504.
Seiler, R.L., Skorupa, J.P., and Peltz, L.A., 1999, Areas susceptible to irrigation-induced selenium contamination of water and biota in the Western United States: U.S. Geological Survey Circular 1180, 36 p.
VanMetre, P.C., and Callender, E., 1997, Water-quality trends in White Rock Creek Basin from 1912-1994 identified using sediment cores from White Rock Lake reservoir, Dallas, Texas: Journal of Paleolimnology, v. 17, p. 239-249.
VanMetre, P.C., Mahler, B.J., and Callender, E., 1997, Water-quality trends in the Rio Grande/Rio Bravo Basin using sediment cores from reservoirs: U.S. Geological Survey Fact Sheet FS-221-96, 8 p.
Preliminary results for 1991- and 1994-Start Study Units--
Maps by Cory Stephens, 17 August 2000
 (54 Kb)
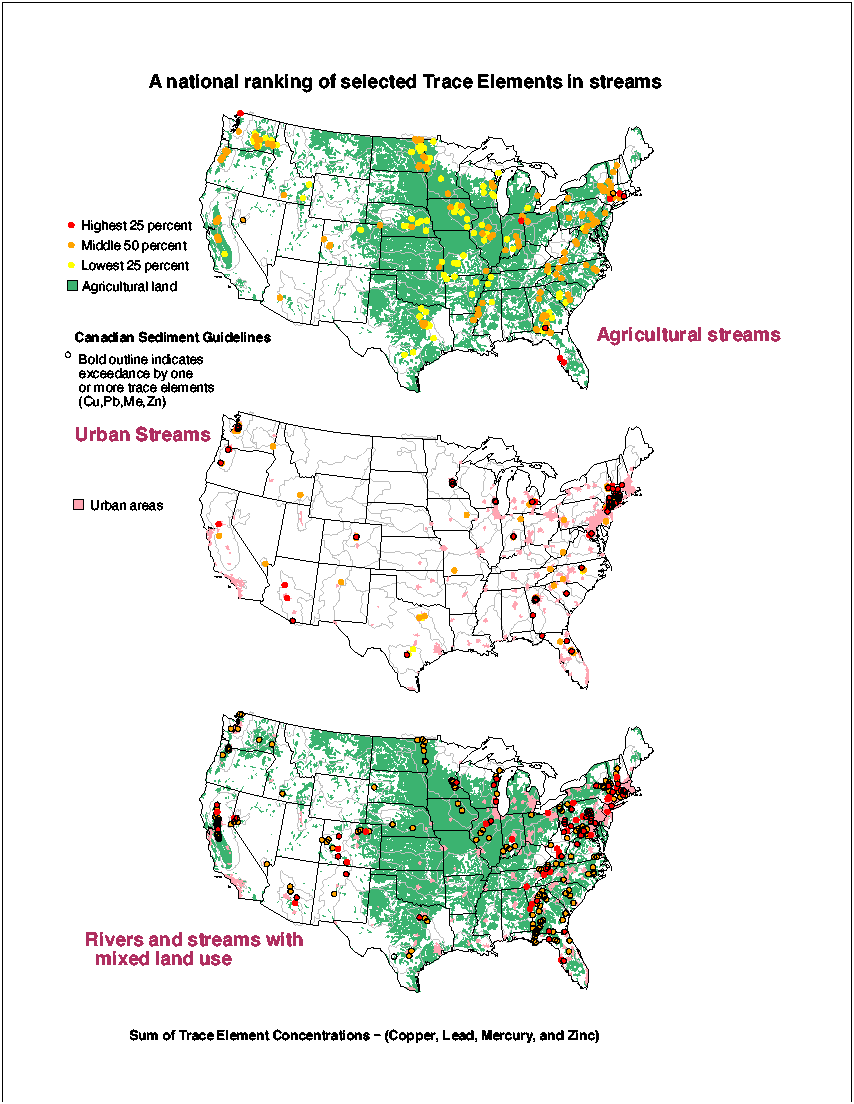
Sum of Trace Elements (Cu+Pb+Zn+Hg) in BED SEDIMENT
-- Also available as a 4.2 Mb PostScript file-- portrait only.
Supporting data:
Concentration and exceedance data for all trace elements analyzed at NAWQA bed-sediment sites (includes replicate and duplicate samples).
Excel or Tab-delimited text
 (19 Kb)
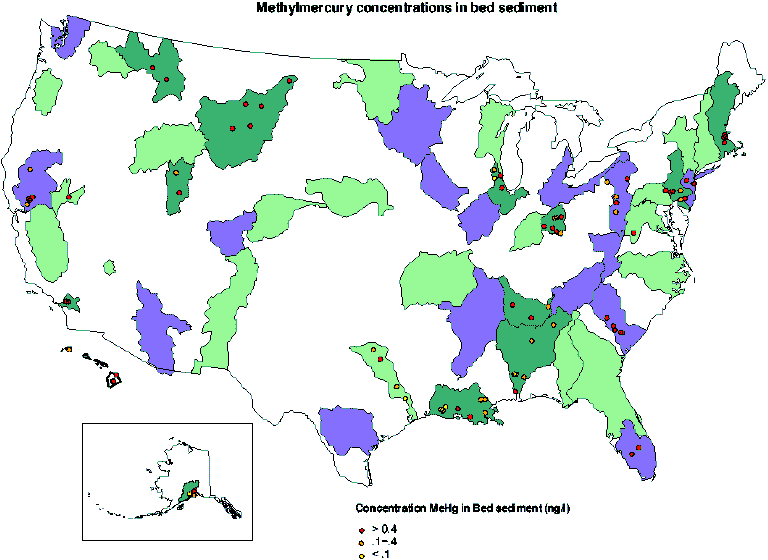
Methylmercury in BED SEDIMENT
-- Also available as a 1.3 Mb PostScript file-- landscape or portrait
Supporting data:
Mercury pilot study data on methylmercury concentrations in bed sediment, tissue, and water, from selected 91, 94, and 97 NAWQA SUs.
Excel or tab-delimited text
Bed sediment concentrations and exceedances for Copper, Zinc, Mercury
and Lead, Sum of constituent concentrations:
Trace Elements measured in bed sediment by 1991 and 1994 study units were used to develop a national overview of Trace element contaminant occurrence in bed sediment.
Bed sediment was collected at 948 sites on rivers and streams in the 36 study units. Individual sites were ranked on the basis of
the sum of individual concentrations for Copper, Lead, Zinc, and Mercury, in bed sediment. For sites at which multiple bed sediment samples were collected, one sample was selected for this analysis.
Generally the first sample collected at an individual site was used for the
purpose of display and analysis. Only samples collected using NAWQA standard protocols
were considered. Generally, the earliest bed sediment sample was selected
for use in display and analysis. For the display of national maps, each sampling site was categorized
as percentiles; red designates the highest 25%, orange the middle 50%, and
yellow the lowest 25%, based on the sum of Zinc, Lead, Copper, and Mercury
concentrations. A bold black outline on individual sampling locations designates
that site as exceeeding the Canadian sediment guideline for at least one or more
constituents. The county-level areas of agricultural land were determined by overlaying a national county boundaries coverage with the Major land
uses coverage by Marschner, revised by Anderson, 1967. Polygons with a land use code (LUC) ranging from 1 through 4 were considered agricultural land. GEOGRAPHIC DISTRIBUTION of Urban Areas:
The data source used to display urban areas is the Metropolitan areas coverage . Polygons having a 1992 population county (POP92) greater than 200,000 were shown as urbanized areas.
Methylmercury in Bed sediment is derived from Dave Krabenhoffs data collection efforts in 1991, 1994 and 1997 NAWQA study units. The data set includes concentrations of methylmercury in water, fish fillets, and sediment. Quartiles were calculated for bed sediment results only. Concentrations are plotted according to > .4 ng/l, .1-.4 ng/l, and < .1 ng/l. Arc Info was used to create a point coverage of the site locations and joined to concentration data to create the map.
For questions or comments on the maps and data analysis, please contact: V. Cory Stephens, cory@usgs.gov, (303) 236-2101 ext. 226
Trace Element National Synthesis internal homepage
National Analysis of Trace Elements (public)
National Water-Quality Assessment (NAWQA) (public)
This page is water.usgs.gov/nawqa-only/trace/summary/bedsed_2p.html
Email comments/questions to traceweb@maildcolka.cr.usgs.gov
Last modified: