|
These downloadable figures have been prepared in near-publication quality. You may only need to do a little editing to make them conform the needs of your report.
The Portable Network Graphics (PNG) files are bitmap images and can not be edited. The Adobe Illustrator (AI) files have been saved to be compatible with Adobe Illustrator 7.0 and more recent
NOTE: If you have problems using these files or need a different format, contact Terri Arnold (tlarnold@usgs.gov). If you don't see a figure on this list that you need and think might be useful to more than one report, let Terri know. If you have any figures you would like to share with other Glacial Report Teams, send them to Terri to add to this web page.
THESE FIGURES WERE UPDATED 09/13/2005 TO REFLECT AN UPDATE TO THE GLACIAL AQUIFER BOUNDARY
Download figures as WinZipped PNG and AI format:
| File Name |
Description |
| bedgeo.zip |
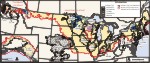 |
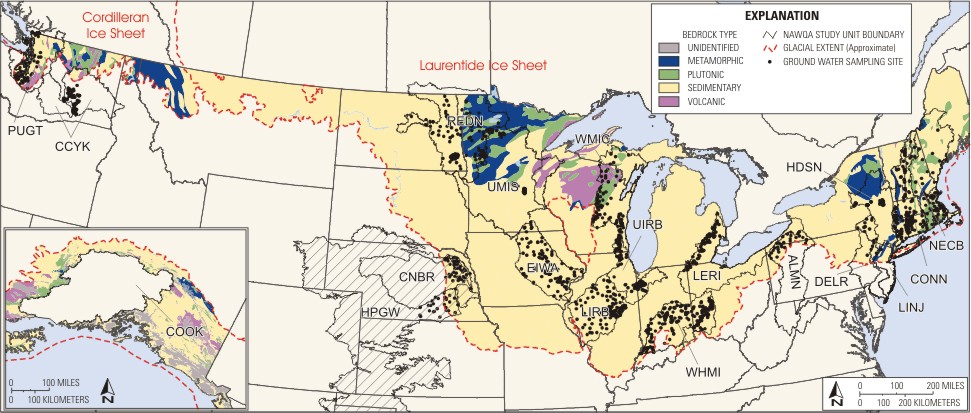
Map showing generalized bedrock geology (both age and type). Data was compiled from Beikman, 1980 (Alaska data) and King and Beikman, 1974 (CONUS data) |
|
| gapt_framework.zip |
| Contains: |
 |
|
framework |
|
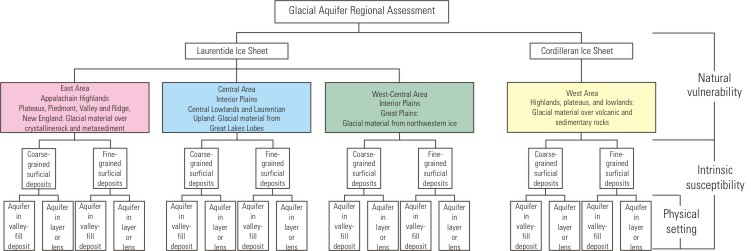
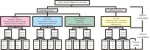
Diagram/flowchart showing Framework for study of the glacial aquifer |
 |
|
ice_sheets |
|
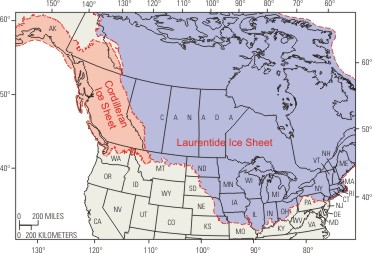
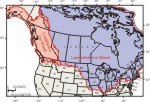
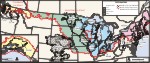
Map showing location of the Cordilleran and Laurentide ice sheets. |
 |
|
regions |
|
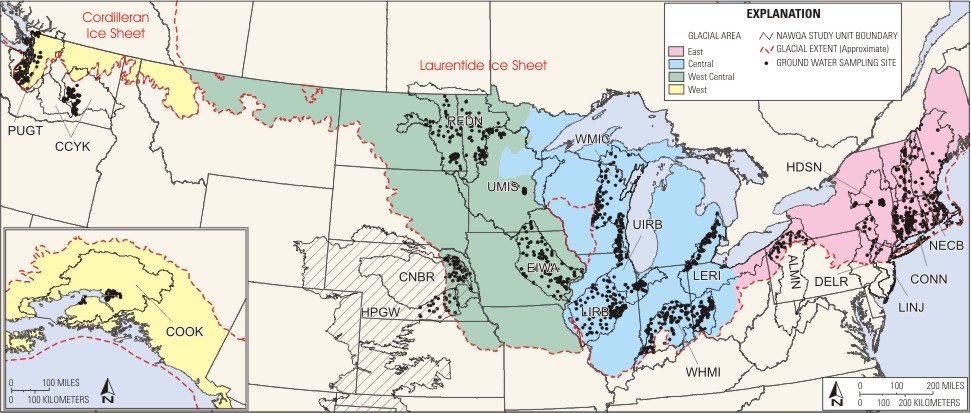
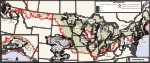
Map showing regions of the Glacial Framework |
 |
|
surftexture |
|
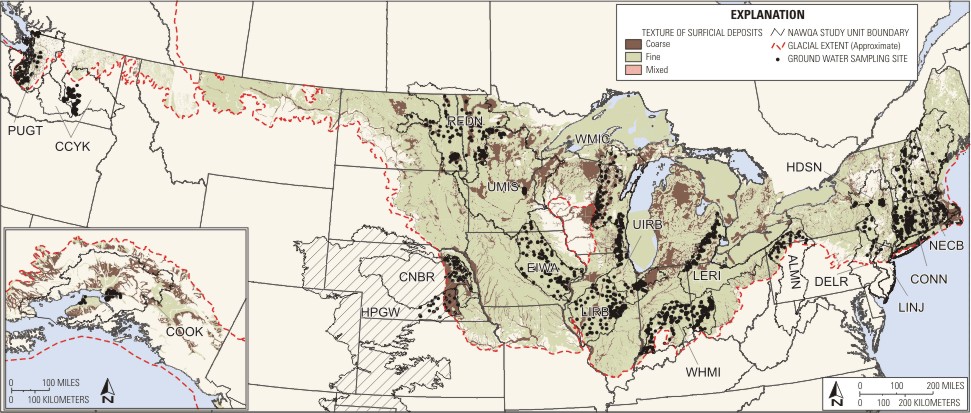
Map showing texture of surficial deposits (coarse- vs fine-grained). Data compiled from Soller DDS-38 and from various USGS geologic maps from Montana, Idaho, Washington, and Alaska |
 |
|
example_xsections |
|
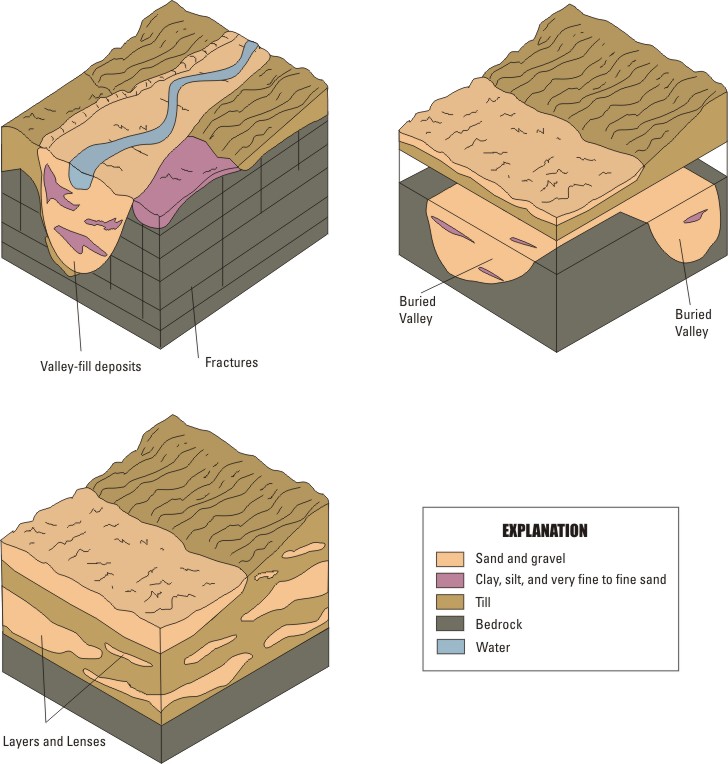
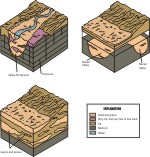
Diagram showing examples of different cross sections in the glacial aquifer to demonstrate deposits in valley fill and layer/lens geometry. |
|
| glacLUSSUSpts.zip |
| Contains: |
 |
|
glac_luswells |
|
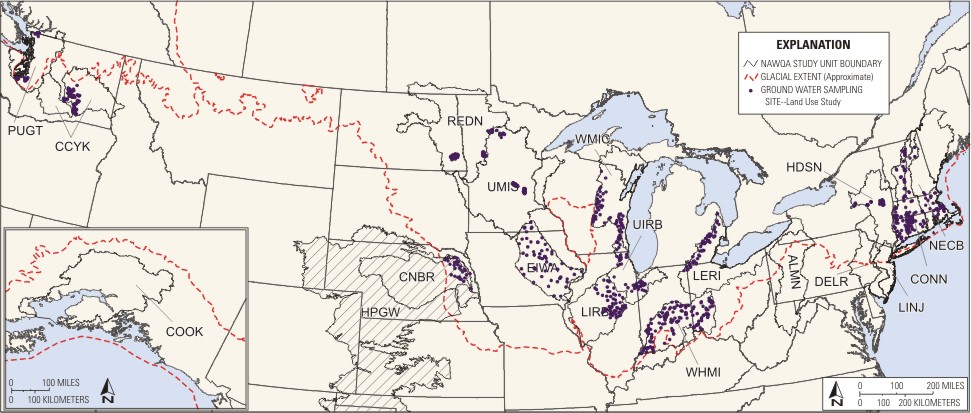
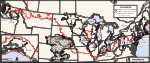
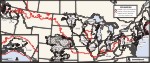
Map showing land use study wells |
 |
|
glac_suswells |
|
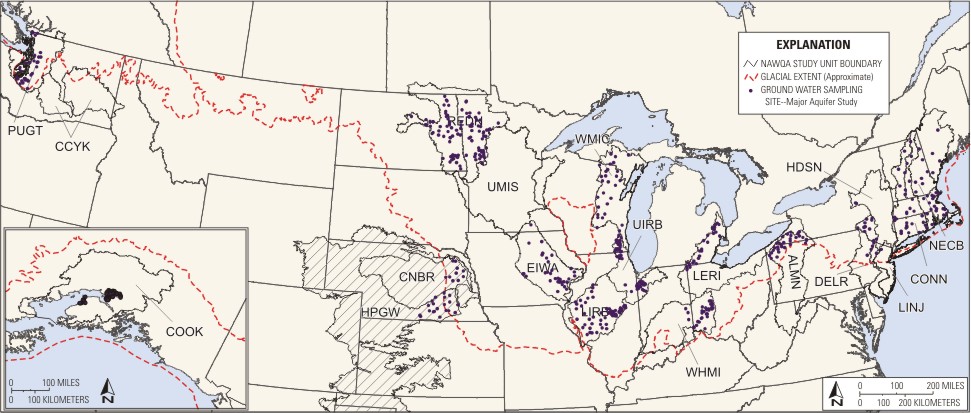
Map showing major aquifer study wells |
|
| landcov.zip
|
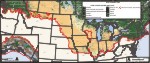 |
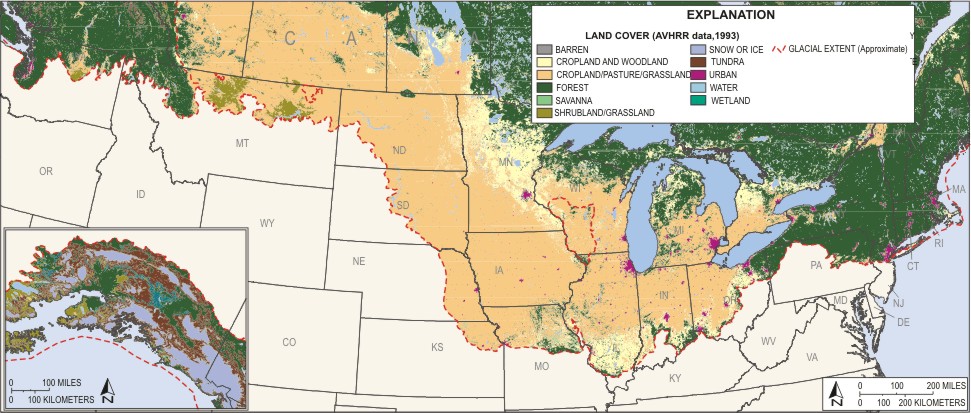
Map showing generalized landuse based on Advanced Very High Resolution Radiometer (AVHRR) data for North America (collected April 1992 - March 1993). Grid downloaded from National Atlas 8-30-2004 and converted to a coverage. |
|
| normal_climate.zip |
| Contains: |
 |
|
normal_aveannppt |
|
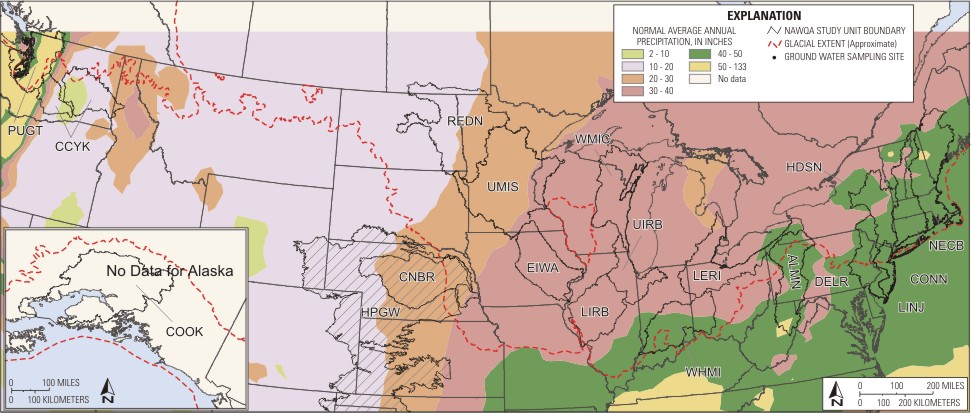
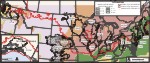
Map showing normal average annual precipitation |
 |
|
normal_aveanntemp |
|
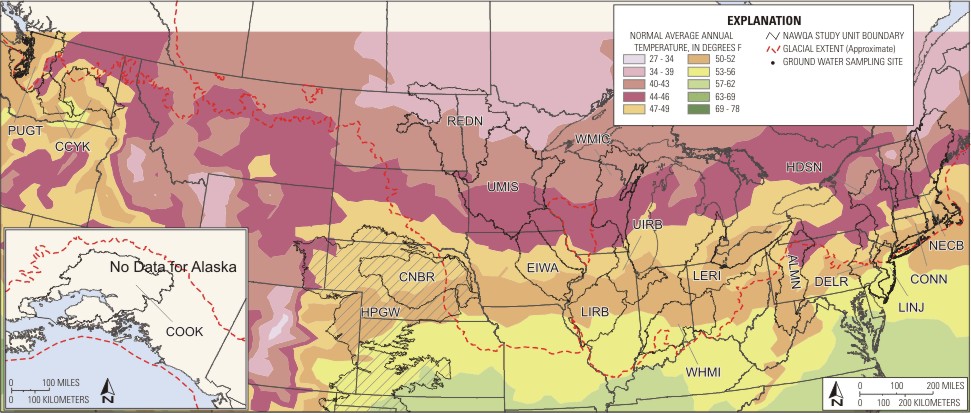
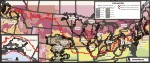
Map showing normal average annual temperature |
|
| QWissues.zip |
| Contains: |
 |
|
QWgraphs |
|
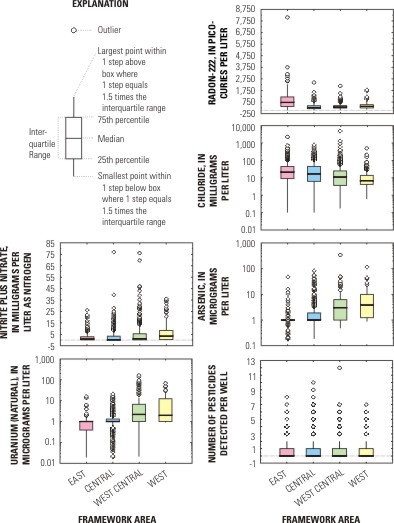
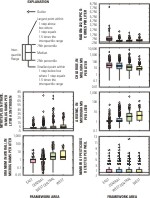
Graphs showing various water quality parameters. Data are from the NAWQA data warehouse retrieved for Glacial reports. Graphs show arsenic, radon-222, nitrite plus nitrate, chloride, number of pesticides detected per well, number of VOCs detected per well, and uranium |
 |
|
QWissues |
|
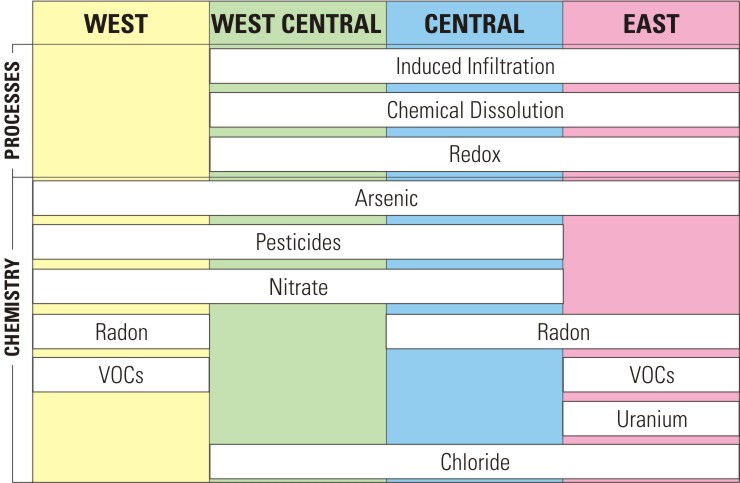
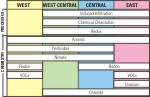
Graph showing major water quality issues that have been identified in the Glacial Aquifer |
|
|
|