Water Resources of the United States
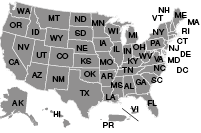
Click the map above to visit a State-specific flood page (if available), or check out one of these State flood databases:
The USGS provides practical, unbiased information about the Nation's rivers and streams that is crucial in mitigating hazards associated with floods. This site provides information about the USGS activities, data, and services provided during regional high-flow events, such as hurricanes or multi-state flooding events. The USGS response to these events is typically managed by the National Floods Specialist.
STN started as a solution for USGS Water Science Centers (WSCs) needing a database to create sites quickly and store small, short-duration data sets of high-water events.
An agreement between the USACE Pittsburgh office and the OH and PA WSCs to collect High-Water Marks (HWMs) at historical locations led to the first dataset of historical HWMs and a need for a field application to collect new HWM data. In 2011, HWMs from Hurricane Irene greatly expanded the database, and that storm exposed the need for expansion to temporary sensor deployments. Both data work together to define short-term events and complement the network of long-term stream and tide gages.
The Flood Event Viewer (FEV) provides immediate public access to both provisional and approved STN data.
The USGS uses the STN system to collect, store, quality-assure, manage, and deliver HWM and short-term sensor data for flood events. STN's short-term event data is used by researchers from the USGS and other public and private entities to study and document flood events, develop inundation maps, evaluate coastal impacts, validate gage peaks, and many other applications.
The pictures and notes are intended for USGS technicians, the public, and emergency managers to visualize the flood and the location for the sensor deployments. The photos are also crucial for helping modelers properly use the HWM and sensor information to calibrate their models. Photos and site sketches help USGS surveyors locate HWMs when survey efforts are delayed and serve as a reference if sensors are lost or displaced. The uncertainty documentation can make a big difference to model calibration.
The data isn't going anywhere! "Short-Term" refers to the nature of the events for which we are collecting data, but the data is intended to be kept indefinitely. In fact, we are opening up the database to make even more historical data available by allowing partners to work with the USGS WSCs to load furnished data. The "short-term" part refers to the length of the deployments/data collection as compared to our long term stream and tide gage networks.
Events in STN are established anytime someone decides to support HWM collection or a sensor deployment. Events have been created in the database for both large and small events. We have worked with FEMA on a 400 sensor/1000+ HWM data collection. We have even had a couple of states work collaboratively to unearth several agencies' HWM filing cabinets and uploaded that data to STN for easier and longer-term accessibility.
Whenever WSCs and cooperators want to work together to collect and provide data on an event, that event can be created.
Yes! Even very limited data on historical events is still important data. We can work with you on how to document the historical HWMs to meet the USGS T&M for uncertainty.
Yes! Each event has a unique URL in the Flood Event Viewer, which is the public mapper for STN. That URL can be used in webpages, press releases, and social media to direct people to the most up-to-date information for that event.
A Site is intended to be a location where data can be collected over and over again for various events. Sensors are deployed at Sites for a specific event. Therefore, each sensor deployment assocates the site with an event. High Water Marks (HWMs) also assocate Sites with Events, because HWMs are collected near a site for a particular event. In general a Site should represent a point of common peak water surface for an event. Therefore, any HWMs or Sensors for a specific site and event should all describe the same peak water surface elevation for that event. Wherever we expect to find more than one water surface elevation (e.g. a sloping water surface, a constriction, or a broken hydraulic connection), those locations should be divided into multiple sites. (Note: In cases where HWMs are used for indirect streamflow measurements, a Site would typically be used to collect all HWMs for a given cross-section of common water surface elevation, and each cross section would be represented by a new Site.)
Storm surge is an abnormal rise in water water above the normal sea level caused principally by low atmospheric pressure related to the high-speed winds swirling around and accompanying a hurricane. As this rise in water moves across the sea with the hurricane and encounters land, the forward momentum of the water and the onshore winds can pile the water on to coastal lands, flooding areas that are normally above sea level.
Storm tide is the combination of the rise in water from storm surge on top of the normal ocean-tides. If storm-surge arrives on land during high-tide, the total water-level can be much higher than if storm-surge occurs at low tide when the water-level may not be as high in certain areas. More information can be found here: The National Hurricane Center's Storm Surge Overview
Peak water surface elevations (HWM elevations) are often surveyed directly using GNSS methods at the HWM. Our technicians may also use electronic leveling techniques (similar to those found here) to determine elevation of the HWM from a local known reference elevation, such as an existing National Geodetic Survey benchmark (NGSBM). In all cases, we are using high-precision instruments to directly determine the elevation of the peak water surface according to a known vertical datum, such as NAVD88.
Height above ground is typically measured from the HWM to the ground surface using a tape measure or engineer's ruler. Once the elevation of the HWM has been measured, we can use the height above ground to compute a ground elevation at the point of the HWM to compare with existing maps and digital elevation models. Our methods for measuring the height above ground are much less exact than our methods for measuring the elevation of HWMs, so the ground height is typically used as a check method, not as a method for determining actual ground elevation. For example, a technician may find a seed line around a tree and mark that line with a nail or other marker. Then he will measure down to the ground surface with a tape measure. But should he measure to the highest exposed tree root, or the mound of detritis around the tree trunk, or to some hard bit of land beneath? Even the most precise lidar maps don't have that kind of precision, so we don't generally dictate the answer to the above question. The technician measures to whatever he considers ground at the time.
Neither the elevation of the HWM nor the height above ground are derived from each other. However, we will often infer the ground surface elevation from the combination of HWM elevation and height above ground. We rarely go the other direction (i.e. we rarely assume a ground elevation from a digital elevation model and use the height above ground to determine water surface elevation). An exception is in the early days of a flood recovery. As the data begins to accumulate in the Flood Event Viewer, the height above ground information will arrive first, because it is a simple tape-down method. Surveyors may come through days later to survey the HWM elevations. But before surveyors complete their work, emergency management personnel may need to begin developing rough inundation models for recovery efforts, and those height-above-ground data may be helpful in drawing preliminary maps, but the final maps should always be drawn to the surveyed HWM elevations.
HWM flagging and HWM surveying are often done in two different campaigns. Whenever time and staffing are limited (as HWMs are quickly destroyed by weather and cleanup efforts), it is often important to flag as many HWMs as we can and then come through later in a second effort to survey the elevations of the flagged HWMs. Some offices use the same form to record both flagging and surveying, while other offices use separate forms.
These are abbreviations for elevation references: