National Water-Quality Assessment (NAWQA) Project
Go to:
U.S. GEOLOGICAL SURVEY
Water-Resources Investigations Report 98-4245
Sacramento, California, 1999
Six of the herbicides (all except acetochlor) were detected by the U.S. Geological Survey studies in shallow ground waterthat is, ground water recharged within the past 10 yearsin a variety of agricultural and nonagricultural settings, as well as in several aquifers that are sources of drinking-water supply. Acetochlor was not detected by the MWPS in the summer of 1994, but was detected in shallow ground water during the NAWQA Program by early 1995, and during another U.S. Geological Survey study in Iowa during the summers of 1995 and 1996. The acetochlor observations suggest that, in agreement with results from previous field studies, some pesticides may be detected in shallow ground water within 1 year following their application.
In accord with the results from other large-scale multistate studies of pesticides in ground water, more than 98 percent of the detections during the NAWQA and MWPS investigations were at concentrations of less than 1 microgram per liter. Consequently, water quality criteria for drinking water that is, standards established to protect human healthwere exceeded at fewer than 0.1 percent of the sites sampled by NAWQA (all of these exceedances involving atrazine alone) and at none of those sampled in 1992 by the MWPS. These criteria, however, may not accurately reflect the overall health risks associated with pesticide detections in water resources because they have been established only for a relatively small number of pesticides and they do not account for the additive or synergistic effects of mixtures, impacts on the health of aquatic ecosystems, or the effects of pesticide degradates. Among the sites sampled during the NAWQA and MWPS investigations, 19.7 and 13.8 percent, respectively, had detections of two or more of the herbicides of interest. Furthermore, for most of the herbicides for which degradates were examined, detection frequencies for major degradates were typically higher than for their respective parent compounds, particularly for the herbicides that are less persistent in aerobic soil.
Frequencies of detection at or above 0.01 microgram per liter in shallow ground water beneath agricultural areas during the NAWQA study were significantly correlated with agricultural use in those areas for atrazine, cyanazine, alachlor, and metolachlor (P<0.05; Spearman rank correlations), but not for simazine (P>0.05). In urban areas, overall frequencies of detection of these five herbicides in shallow ground water were positively correlated with their total nonagricultural use nationwide (P=0.026; simple linear correlation). Multivariate statistical analysis indicated that frequencies of detection in shallow ground water beneath agricultural areas were positively correlated with half-lives for transformation in aerobic soil and agricultural use of the compounds (P<0.0001 for both parameters). Although frequencies of detection were not significantly correlated with their subsurface mobility (Koc; P=0.19) or the median well depths of the sampled networks (P=0.72), the range of Koc values among the five herbicides and the range of well depths were limited.
The widespread use of synthetic organic pesticides over the past several decades has led to their frequent detection in ground water (Barbash and Resek, 1996), surface water (Larson and others, 1997), aquatic biota and sediment (Lisa Nowell, U.S. Geological Survey, written commun., 1998) and the atmosphere (Majewski and Capel, 1995). (In this report, the word pesticides is used to refer to all economic poisons [Meister Publishing Company, 1998], including herbicides, insecticides, fungicides, fumigants and other chemicals used to kill, repel, or otherwise control unwanted organisms.) Concerns about the potential impacts of pesticides on human health, as well as on terrestrial and aquatic ecosystems, have led to a wide range of monitoring and management programs by state and federal agencies. For the protection of ground water, the U.S. Environmental Protection Agency (USEPA) is proposing legislation to require that individual states and tribes develop a Pesticide Management Plan (PMP) for each of several pesticides (U.S. Environmental Protection Agency, 1991).
In 1991, the USEPA published Pesticides and Ground-Water Strategy, the principal goal of which was to manage the use of pesticides in order to prevent adverse effects on human health and the environment and to protect the environmental integrity of the Nations ground-water resources. The centerpiece of this Pesticides Strategy is the development and implementation of State Management Plans [now referred to as Pesticide Management Plans, or PMPs] for specific pesticides of concern that will ultimately form an integrated part of state [and tribal] Ground-Water Protection Programs (U.S. Environmental Protection Agency, 1991). These plans are to be implemented for any pesticide deemed to have a high leaching potentialand for which national label or restricted use requirements are unlikely to ensure adequate protection of ground waterbut whose use is not cancelled on a national basis (U.S. Environmental Protection Agency, 1991). Guidelines for the development and implementation of these plans are summarized by the U.S. Environmental Protection Agency (1993) and Browner (1996).
Initially, the proposed PMPs will focus on five predominantly agricultural pesticidesthe triazine herbicides atrazine, cyanazine, and simazine; and the acetanilide herbicides alachlor and metolachlor. (At the time of this writing, the removal of cyanazine from this list was under consideration; discussion of this compound, however, has been retained here because data on its occurrence in ground water provide valuable information on the manner in which the use and properties of pesticides influence the likelihood of their detection in ground water.) According to the proposed rule (Browner, 1996), the initial focus of the PMPs on these compounds is based on a variety of concerns, including (1) their widespread detection in ground water, sometimes at concentrations exceeding water-quality standards; (2) their association with serious and irreversible toxicological effects, including carcinogenicity; (3) their extensive, broad-spectrum use, especially in agricultural settings; and (4) the widespread availability of analytical methods for their detection. As the PMPs evolve, their analytical scope may expand to include additional pesticides and, perhaps, their transformation products, or degradates. For this report, the five herbicides upon which the currently proposed PMPs focus are referred to as the PMP herbicides, and the term pesticide compounds is used to refer to pesticides in conjunction with any of their degradates.
This report summarizes current understanding on the occurrence of atrazine, cyanazine, prometon, simazine, acetochlor, alachlor, and metolachlorand some of their degradatesin ground water of the United States, primarily on the basis of results from two large-scale studies by the U.S. Geological Survey (USGS), the National Water-Quality Assessment (NAWQA) Program and the Midwest Pesticide Study (MWPS). In addition to the five PMP herbicides, this list includes two other parent compounds. The first is prometon, an herbicide that is of interest because it has been used almost exclusivelyand, as will be seen, widely detectedin nonagricultural settings; its inclusion expands the scope of this analysis beyond predominantly agricultural pesticides. The second is acetochlor, an herbicide first introduced in the United States in 1994 (Kolpin and others, 1996a) to partly replace the use of atrazine and alachlor. Data on the occurrence of acetochlor in ground water provide an indication of the time required for an agricultural pesticide to reach detectable concentrations in ground water, if it does so at all, following initiation of its widespread use. Prometon and acetochlor were also included because of their chemical similarity to the other five compounds. Prometon, like atrazine, cyanazine, and simazine, is a triazine herbicide, whereas acetochlor, like alachlor and metolachlor, is an acetanilide herbicide. This discussion includes (1) a summary of the overall frequencies of detection and concentrations of these compounds observed in ground water during the USGS investigations and comparisons with the results from other multistate studies; (2) an examination of the extent to which detections of these herbicides in shallow ground water during the NAWQA Program were correlated with their use, their physical and chemical properties, and well depth; and (3) an overview of the spatial distributions of the herbicides reported in ground water by the USGS studies in agricultural and urban settings, as well as in areas of mixed land use, in relation to their geographic patterns of agricultural use.
Many factors, both natural and anthropogenic, affect the likelihood of detecting pesticides in ground water (table 1). Among these, the factors examined in this report are related to study design, pesticide properties, and pesticide use. To the extent possible, the effects of study design are accounted for in each part of the data analysis. Current understanding of the effects of pesticide use, pesticide properties, and hydrogeologic setting on pesticide occurrence are reviewed below as a background for this analysis. Correlations between frequencies of pesticide detection in ground water and many of the other factors listed in table 1for these and many other pesticide compoundshave been discussed in previous summaries of the MWPS results (for example, Burkart and Kolpin, 1993; Kolpin and others, 1994; Kolpin, 1997) and will be examined in subsequent publications for the NAWQA Program.
History and Patterns of Use
It is reasonable to suppose that the more intensively a pesticide is used in a given area, the more likely it is to be detected in ground water, but the evidence in support of this hypothesis is remarkably sparse (for example, Barbash and Resek, 1996; Kolpin and others, 1998a). This may, in part, be a consequence of the limitations in the spatial and temporal resolution of the data currently available on pesticide use in the United States. At present, the finest scale at which pesticide use information can be obtained across the Nation is on a countywide basis, and only for their applications within agricultural settings (Gianessi and Anderson, 1995). Data on nonagricultural pesticide use are considerably more limited and are available only at a national scale (Gianessi and Puffer, 1990).
Historical trends in nationwide use for the seven herbicides in agricultural settings are shown in figure 1. Because use information was not available for every year, the figure displays data only for the years 1964 (Eichers and others, 1968), 1966 (Eichers and others, 1970), 1971 (Andrilenas, 1974), 1976 (Eichers and others, 1978), 1988 (Gianessi and Puffer, 1990), 1992, and 1994 (acetochlor only). These data indicate that national agricultural use of atrazine and alachlor increased sharply between 1964 and 1976, then generally declined from that time until 1992 precipitously for alachlor, but less dramatically for atrazine. For simazine, cyanazine, and metolachlor, agricultural use increased monotonically from the year when initial data were available for each compound until 1992. The only data shown for acetochlor are for 1994, when its use commenced in the United States.
Table 2 lists the primary agricultural and nonagricultural uses of the seven herbicides, as well as recent estimates of the total amounts applied and areas treated nationwide on an annual basis, if available. The data on use in agricultural areas are based on information gathered for the years 19911995. Expressed in terms of the total amounts applied annually, the use of atrazine and metolachlor in agricultural areas exceeds that in nonagricultural areas by one to two orders of magnitude, whereas simazine use is of the same order of magnitude in the two settings. Cyanazine and alachlor are used exclusively for agricultural purposes. Applications of acetochlor are also likely to be restricted to agricultural settings, but no data on its nonagricultural use are available. By contrast, prometon is an almost exclusively nonagricultural herbicide, but no data are available on its nationwide use in either agricultural or nonagricultural settings.
Estimates of the average amounts applied annually per treated acre in agricultural settings (obtained by dividing the total pounds applied per year by the total number of treated acres) suggest that the intensity of agricultural use, averaged across the Nation, is relatively consistentthat is, within a factor of twoamong the six herbicides for which such data are available (table 2). Figure 1 and table 2 also indicate that, despite its recent introduction in 1994, the use of acetochlor in the United States in that year was nearly as extensive as that of alachlor. Geographic distributions of use for the six predominantly agricultural herbicides (that is, all but prometon) will be examined in a later section, in conjunction with discussions of their individual patterns of occurrence in ground water.
Physical and Chemical Properties
All other factors being equal, the likelihood of detecting one pesticide in ground water compared to another is directly related to the degree of partitioning into the aqueous phase, relative to soil organic matter or soil gas (which, in turn, affects relative mobility in the aqueous phase), and the relative resistance to chemical transformation in soil, with or without mediation by microorganisms. (The influences of other factors related to pesticide detections in ground water, such as study design, pesticide use, recharge, hydrogeologic setting, and soil properties [table 1] are discussed later in this report.) For each of the seven herbicides, table 3 summarizes recent data on some of the principal physical and chemical properties most often used to characterize pesticide mobility and persistence in ground water.
Data on the occurrence of the principal degradates of a given pesticide in ground water can provide additional information regarding the areas where ground-water quality has been affected by its use. As will be shown later in this report, such data can also be used to test hypotheses on the importance of persistencerelative to nontransforming processes such as sorption and dilutionin governing frequencies of detection of the parent compound. For these reasons, table 3 also lists for the seven herbicides most of the known degradates that have been looked for and, where applicable, detected in ground water.
Most of the quantitative data in table 3 were obtained from the U.S. Department of Agriculture Agricultural Research Services (USDAARS) Pesticide Properties Database (U.S. Department of Agriculture, 1995). When more than one value was available for a given parameter in the USDAARS database, the number chosen for display was the value recommended by the database authors. For aerobic soil half-life, when multiple values were available in the USDAARS database for a given herbicide, but none was selected by the database authors, the value measured in a loam soil (silty loam, loamy silt, or silty clay loam) was the one chosen for display in table 3. The parameter values given for acetochlor in the table were taken from the U.S. Environmental Protection Agency (1994) because none of these data were available for acetochlor in the USDAARS database. Although all of the parameters listed in the table are known to vary considerably with temperature, no data on the temperature(s) of measurement were available for two of the four variables listed, a situation commonly encountered in the literature (Barbash and Resek, 1996).
The soil organic carbon partition coefficient (Koc), a measure of the tendency of a compound to partition into soil organic carbon from aqueous solution, provides a quantitative, inverse indication of its anticipated mobility in ground water. Water solubility is often invoked as a measure of the relative likelihood of pesticides to be detected in ground water and is included in table 3 for this reason. Water solubility is less appropriate for this purpose than Koc, however, because unlike the latter parameter, water solubility does not account for sorptive interactions between the compound and solid-phase organic matter in the subsurface (Barbash and Resek, 1996). Table 3 also includes estimates of the Henrys law constant, a parameter that quantifies the relative degree of partitioning between gas and aqueous phases in the unsaturated zone; these data suggest that the acetanilide herbicides have a greater tendency to volatilize from aqueous solution than do the triazines.
The parameter used most commonly to quantify the environmental persistence of pesticides in soil is the field dissipation half-life, which represents the amount of time required for the concentration of a compound measured in a field soil to decrease to half of its initial value. Despite its widespread use, however, this parameter is of only limited utility for understanding the rates and mechanisms of the underlying processes responsible for dissipation in soil because it does not distinguish between decreases in concentration caused by the actual transformation of the parent compound and those caused by its transport away from the site of measurement in air, ground water, or surface water (Barbash and Resek, 1996). Consequently, for the purposes of this report, persistence was quantified by using transformation half-lives in aerobic soil. Aerobic soil half-lives are measured in a laboratory and, thus, are less representative of field conditions than the field dissipation half-life. However, because aerobic soil half-lives are measured under conditions that are considerably more controlled and standardizedand unaffected by offsite transportcomparisons among different compounds and different studies are more reliable for aerobic soil half-lives than for field dissipation half-lives. According to the data listed in table 3, the time scales of transformation of these herbicides in aerobic soil may vary from weeks to years.
Hydrogeologic Setting
As is the case for other surface-derived contaminants, the hydrogeologic factors that influence the movement of pesticides to ground water (table 1) are primarily those that control the movement of water. Thus, pesticide detections in shallow ground water tend to be more common in areas with permeable soils than in areas covered by glacial tills, clays, and other low-permeability geologic materials. In addition, higher levels of organic carbon in soils and other subsurface materials may diminish the likelihood of pesticide contamination of ground water by slowing pesticide migration (through sorption) and, for compounds susceptible to biotransformation, by enhancing microbial activity. Pesticide detections generally are more common in unconsolidated and solution-weathered (karst) aquifers than in relatively unweathered bedrock aquifers. Unconfined aquifers are more susceptible to contamination than those that are confined. In general, pesticide contamination tends to be more likely, and more temporally variable, in shallow ground water than in deep ground water (Barbash and Resek, 1996). Ground water in alluvial aquifers associated with rivers carrying substantial pesticide loads often contains detectable levels of pesticides (Squillace and others, 1993), particularly where the infiltration of the river water is enhanced by the pumping of nearby wells (Blum and others, 1993).
This report focuses primarily on the results from recent studies by the USGS, the designs of which are summarized later in this section. To facilitate comparisons of the USGS results with those from other work, however, the designs of other large-scale studies and their various sampling strategies are briefly described below.
Overview of Non-USGS Regional and National Studies of Pesticides in Ground Water
More than 120 studies to date have examined the distributions of pesticides in ground water across areas ranging from individual watersheds, metropolitan areas or counties, to entire states. Of these, at least 26 in at least 17 states have involved statewide sampling. Studies involving the sampling of ground water for pesticides across multistate areas, however, have been much more limited (Barbash and Resek, 1996). To date, the results from fewer than 10 multistate studies have been reported, not including assemblages of small-scale field studies carried out in multiple locations in different states for individual pesticides such as aldicarb (Jones and others, 1986), atrazine (Komor and Emerson, 1994), thiodicarb (Jones and others, 1989) and simazine (Roux and others, 1991b).
The principal characteristics of the seven multistate studies whose results have been reported most widely are listed in table 4. Five of the investigations listed in the table obtained their samples exclusively from wells; although the NAWQA Program and Cooperative Private Well Testing Program, or CPWTP, focus primarily on wells, they also include the sampling of selected springs (Gilliom and others, 1995; Richards and others, 1996; Kolpin and others, 1998a). Whereas four of the studies in table 4 have been completed, the MWPS (Kolpin and others, 1995, 1996b), NAWQA, and CPWTP are still underway. Consequently, the results discussed for the latter three investigations will include those drawn from the most recent compilations available from each. Typically, the findings from each of the multistate studies have been reported in multiple publications; the references cited in table 4 contain the most comprehensive descriptions of the study design and principal findings for each investigation. Most of the primary design features of these studies are compared in table 5.
Compounds All of the multistate investigations examined at least one of the herbicides of interest (table 4), and most analyzed for one or more of their degradates (tables 5 and 6). The analytical results from the CPWTP, however, cannot be compared directly with those from the other multistate studies because, unlike the compound-specific analytical methods employed by the other studies, the relatively inexpensive immunoassay techniques employed by the CPWTP have exhibited extensive cross-reactivity among structurally related compounds, reliably identifying the pesticides of interest only in terms of their principal chemical class (that is, triazines or acetanilides) rather than as individual compounds.
Of all the multistate studies undertaken to date, the most spatially extensive was the National Pesticide Survey (NPS) undertaken by the U.S. Environmental Protection Agency (1990, 1992). The NPS was the only investigation to sample wells in all of the 50 states (table 4). In contrast, the most geographically restricted of the multistate studies was the Metolachlor Monitoring Study (MMS; Roux and others, 1991a), which sampled wells in only four states. The MMS also sampled the fewest wells (240) of all the multistate studies, whereas the CPWTP sampled the largest number to date (at least 14,044 wells sampled for triazine herbicides, as of 1993). Maps showing the spatial distributions of sampling for all of the multistate investigations, except for the Ciba-Geigy atrazine study (CGAS; Balu and others, 1998) and NAWQA study, have been provided by Barbash and Resek (1996).
Studies that target areas where ground-water contamination by specific compounds is more likelyeither because of higher chemical use, enhanced ground-water vulnerability to surface-derived contam-ination, shallower or more poorly constructed wells, or other circumstancesgenerally detect the compounds more frequently than nontargeted studies (Barbash and Resek, 1996; Ryker and Williamson, 1996). A sum-mary of the criteria used by each of the multistate investigations to select sampling locations is given in table 7.
Among the multistate studies, the NPS had the lowest degree of spatial bias toward areas vulnerable to pesticide contamination (table 7). Through stratified random site selection, the NPS provided the most sta-tistically representative summary available to date of pesticide and nitrate occurrence in community water-supply and rural domestic wells of the United States. However, because the wells used for the NPS were selected without controlling for variations in well char-acteristics (for example, well construction or depth) or hydrogeologic setting, the NPS constituted a nation-wide assessment of well-water quality rather than ground-water quality (U.S. Environmental Protection Agency, 1992). The CGAS, MMS and National Alachlor Well-Water Survey, or NAWWS (Holden and others, 1992), had the most pronounced bias toward areas where detections of the target compounds were more likely. The CGAS placed a major emphasis on sampling wells with known atrazine detections, whereas the MMS and NAWWS focused their sampling on areas where the pesticides of primary interestmetolachlor and alachlor, respectivelywere known to have been used (MMS) or purchased (NAWWS). In addition, the MMS and CGAS focused specifically on areas presumed to be more vulnerable to pesticide contamination because of high pesticide use and greater susceptibility to surface-derived contamination (for example, because of a shallower water table, sandier soils, or more permeable subsurface materials).
The CPWTP, NAWQA, and MWPS investigations were designed with an intermediate level of bias toward areas where pesticide detections in ground water would be more likely. Although these three studies have focused primarily on areas of the country dominated by agricultural activities (thereby increasing the likelihood of detecting agricultural pesticides in ground water), they have not specifically targeted areas that are highly vulnerable to contamination or where particular compounds were used or known to have been detected. (The first full-scale phase of NAWQA, the phase examined for this report, involved a pronounced emphasis on agricultural areas, but subsequent stages of the program have involved a greater focus on nonagricultural settings, especially urban areas.) However, while the NAWQA and MWPS investigations selected their sampling locations using consistent study designs based on well characteristics, hydrogeologic setting, and land use (table 7), the sampling for the CPWTP program was done by individual homeowners interested in having their well or spring water tested for the presence of agrichemicals. Thus, like the NPS, the CPWTP is an assessment of well- and spring-water quality, rather than of ground-water quality, in the areas sampled (Richards and others, 1996).
The principal objectives of the NAWQA Program are to describe the status of and trends in the quality of the Nations ground-water and surface-water resources and to link assessment of status and trends with an understanding of the natural and human factors that affect the quality of water (Gilliom and others, 1995). This ongoing assessment examines water quality in 59 major hydrologic basins, or study units, across the United States (fig. 2), representing approximately 60 to 70 percent of the ground-water and surface-water use in the Nation.
To maintain a consistent level of effort from one year to the next, the NAWQA Program concentrates most of its sampling into a 3-year high-intensity phase in approximately one-third of the study units at any point in time. Long-term variations in water quality are examined through the use of a rotating cycle in each study unit3 years of intensive sampling followed by 6 years of relatively low-intensity activity. The water-quality conditions observed in a given 3-year high-intensity phase are then reexamined during the next high-intensity phase beginning 6 years later (Gilliom and others, 1995).
The ground-water quality assessment for NAWQA consists of three components: the subunit survey (SUS), the land-use study (LUS), and the flowpath study (Gilliom and others, 1995; Squillace and others, 1996). Subunit surveys provide large-scale spatial descriptions of the quality of water drawn primarily from aquifers representing current or future sources of drinking water (referred to as drinking-water aquifers, or DWA, in this report) through the sampling of existing wells of widely varying depths and selected springs (ground water of widely varying ages) across large subsections of individual study units, referred to as aquifer subunits (table 7). Land-use studies assess the quality of shallow ground water (recharged within approximately the past 10 years) through the sampling of either existing or newly installed wells in more limited areas characterized by specific types of land use. (Because the SUS boundaries are established by hydrogeologic rather than cultural features, most of them sample areas with mixed land use.) Flowpath studies employ the sampling of special monitoring wells to examine the evolution of shallow ground-water quality along inferred flowpaths in the subsurface. A national assessment of ground-water quality, and the processes that control it, is obtained by combining the results reported by the individual NAWQA study-unit investigations from across the country.
This report summarizes SUS and LUS results from the first intensive data collection phase of the NAWQA Program (19931995). These studies were conducted in the study units begun in fiscal year 1991 (shown in yellow in fig. 2). Figure 3 shows the areas sampled for the LUSs of interest, whereas figure 4 shows those sampled for the SUSs. Some of the principal characteristics of these LUSs and SUSs are summarized in table 8. Although the 19931995 LUSs also focused on other land-use settings, only those undertaken in agricultural and urban areas were sufficiently numerous to merit discussion here. (For the purposes of this report, the term urban includes suburban, as well as more densely populated urban settings, but generally excludes heavily industrialized areas.) Furthermore, the only LUSs or SUSs examined here, or included in table 8, are those for which 10 or more sites (wells or springs) were sampled for pesticide analyses. The pesticide occurrence data summarized in this report for the NAWQA Program were compiled in May 1998.
Chemical analyses for all of the pesticide compounds discussed in this report for the NAWQA study were carried out using solid-phase extraction onto C-18 cartridges followed by capillary-column gas chromatography/mass spectrometry, or GC/MS (Zaugg and others, 1995). As noted by Kolpin and others (1998a), the method detection limits (MDL) for the NAWQA Program (table 4) provide an indication of the relative sensitivities of the analytical methods to the different compounds examined, but were not used as lower thresholds for reporting detections. Instead, pesticide detections were reported when specific analytical identification criteria were met on the basis of gas chromatographic retention times and mass spectral peak areas, rather than concentration thresholds (Zaugg and others, 1995). For this reason, concentration values presented for individual pesticides from the NAWQA Program are, in some instances, lower than the MDLs given in table 4. Pesticide detections for the other multistate studies (including the MWPS), however, were based strictly on the reporting limits summarized in table 4.
The results from the NAWQA LUSs and SUSs provide information on the quality of shallow ground water, as well as water obtained from drinking-water aquifers. However, because shallow ground water is a source of supply in many of the areas examined, each LUS or SUS in table 8 was designated as an investigation of the quality of either shallow ground water (SGW), a DWA, or both. While all of the LUSs were, by design, classified as SGW, only those sampling DWAs were classified as both SGW and DWA. An SUS that sampled a recently recharged DWA may also have been designated as both SGW and DWA (Gilliom and others, 1998), provided its median well depth was less than or comparable to those for the LUSs undertaken in the same study unit, or if other evidence suggested that the wells in the SUS sampled ground water that was susceptible to surface-derived contamination.
The MWPS was designed to investigate the spatial distributions in ground water of the principal herbicides used for corn and soybean cultivation, and some of the major degradates of these herbicides, in the northern midcontinent (fig. 5; tables 4 through 7). Successive rounds of sampling during the program also have provided opportunities to examine changes in these distributions between preplanting and postplanting periods of the growing season, as well as from one year to the next. The study region is restricted to the set of contiguous counties in the 12 states of the northern midcontinent where, at the time of well selection, 25 percent or more of the cropland was devoted to the cultivation of corn and soybeans (table 7). Sampling focuses exclusively on near-surface aquifers, defined as those for which the top of aquifer material [is] within 50 ft of land surface, regardless of whether the material is saturated or unsaturated (Kolpin and Burkart, 1991). All wells are screened in a single near-surface aquifer, either unconsolidated or bedrock, and were chosen such that at least 25 percent of the surrounding area within a 2-mile radius was planted in corn or soybeans during the growing season immediately preceding the period of well selection. The resulting reconnaissance network consists of 303 wells, one per county for each of the two aquifer types (where available) in the 12-state study area (Kolpin and others, 1996b). Because of geologic variations across the northern midcontinent, bedrock aquifers are encountered more commonly in the central and southeastern part of the study area than in the western and northeastern areas (fig. 5). Chemical analyses for the seven herbicides of interest, as well as for the atrazine degradates deethylatrazine (DEA) and deisopropylatrazine (DIA), have been carried out using the same analytical method employed for these compounds during the NAWQA study, that is, solid-phase extraction onto C-18 cartridges followed by capillary-column GC/MS (Kolpin and others, 1995). Additional methods (Kolpin and others, 1995, 1996b) have been used for the analysis of selected degradates of alachlor and cyanazine, as well as for all analyses of the seven herbicides and their degradates that employed reporting limits lower than 0.05 µg/L for the 1992 sampling (tables 4 and 6).
As indicated in table 4, data from five rounds of sampling over a 4-year period (1991-1994) have been reported to date for the MWPS. For the first year (1991), the entire network (with some minor attrition from the original set of 303 available wells) was sampled twiceonce before, and once following most of the spring herbicide applications (Kolpin and others, 1994). In 1992 (Kolpin and others, 1995), samples from a randomly selected subset of 94 wells from the network were subjected to more sophisticated chemical analyses that involved a broader range of pesticide compounds, including a threefold increase in the number of degradates examined (table 6) and considerably lower analytical detection limits (table 4). The 1993 sampling was designed to examine the effects of the 1993 Mississippi River floods on the occurrence of herbicides and their degradates in the near-surface unconsolidated aquifers within the inundated parts of the study area, focusing on sites that received greater than 150 percent of normal rainfall that spring (Kolpin and Thurman, 1995). Thirty-eight of the wells screened in unconsolidated aquifers were sampled in 1994 (Kolpin and others, 1996b). A comprehensive description of the overall design of the MWPS, including the methods employed for well selection, sampling, chemical analysis, and quality assurance, has been provided by Kolpin and others (1994).
All other factors being equal, studies that employ lower reporting limits for a given pesticide generally observe higher frequencies of its detection than those using higher reporting limits (for example, Burkart and Kolpin, 1993; Barbash and Resek, 1996). This inverse relation makes it difficult to compare detection frequencies among different compounds, different studies, or different phases of the same study if reporting limits are not uniform. To compensate for this, detection frequencies for the USGS studies are computed on the basis of a common reporting limit whenever such comparisons are made in this report, as has been done in previous discussions of the results from the MWPS (for example, Kolpin and others, 1994) and NAWQA investigations (Kolpin and others, 1998a). Comparisons of the USGS results with those from the other multistate studies are also carried out on the basis of common reporting limits.
Because the MWPS has involved five rounds of sampling, the results from a single phase of the study were chosen for comparison with those from the NAWQA investigation. The 1992 MWPS sampling was selected for this purpose because it was the study phase that was closest in time to the NAWQA sampling (19931995), while avoiding both the unusual climatic conditions represented by the 1993 floods (Kolpin and Thurman, 1995) and the much more limited sampling of 1994 (Kolpin and others, 1996b). Another reason why the 1992 data from the MWPS were chosen for these comparisons was that among all of the phases of the MWPS to date, the analytical scope and detection limits of the 1992 sampling were most similar to those employed for the NAWQA Program (table 4). To facilitate comparisons with the NAWQA data, frequencies of pesticide detection from the 1992 MWPS sampling were computed using a reporting limit of 0.01 µg/L. Because higher detection limits were employed at other times during the MWPS (table 4), however, comparisons among the results from different phases of the MWPS were conducted using a higher reporting limit of 0.05 µg/L.
Most of the pesticide compounds examined in this report were among those detected most frequently in ground water during the NAWQA study. This is evident from figure 6, which displays the 10 pesticide analytes with the highest frequencies of detection at or above 0.05 µg/L at the agricultural LUS sites during the NAWQA Program. Also shown are the frequencies with which these compounds were detected in shallow ground water sampled in urban areas (urban LUSs) and in ground water sampled in areas of mixed land use (SUSs). The detection frequencies in figure 6 were calculated for a reporting limit of 0.05 µg/L, rather than 0.01 µg/L, to accommodate the higher reporting limits associated with a second analytical method employed by NAWQA for approximately half of the pesticide compounds examinedthat is, high-pressure liquid chromatography with spectrophoto-metric detection (Werner and others, 1996) rather than GC/MS. Although many of the NAWQA sites were sampled more than once for pesticides, the frequencies of detection shown in figure 6 were computed using data from only one sample per site on the basis of the most recent compilation for the NAWQA pesticide results (U.S. Geological Survey, 1998).
In general, variations in the frequencies of detection among compounds, settings, and study phases for the NAWQA and MWPS investigations reflect the effects of differences in the rates, timing, and settings of pesticide use; contrasts in the environmental persistence of the compounds; and variations in climatic conditions and sampling depth. The frequencies of detection of atrazine, cyanazine, prometon, simazine, acetochlor, alachlor, and metolachlor in ground water during the NAWQA Program are presented in figure 7, relative to a common reporting limit of 0.01 µg/L. For each herbicide, overall detection frequencies are shown for four sampling components from the NAWQA ground-water studiesshallow ground water sampled in areas of agricultural, urban, and mixed land use (agricultural LUSs, urban LUSs, and SUSs sampling shallow ground water, respectively), and deeper ground water sampled beneath areas of mixed land use (remaining SUSs).
In figure 7, the NAWQA data are also compared with the results from the 1992 sampling for the MWPS, using the same reporting limit of 0.01 µg/L. Consistent with the fact that the MWPS sampled shallow ground water in predominantly agricultural areas, the relative frequencies of pesticide detection for this study are more similar to those observed for the agricultural LUSs than for any of the other three components of the NAWQA program. (These similar-ities will be examined in greater detail in later sections of this report.) In addition, the patterns of pesticide detection in the areas of mixed land use for the NAWQA program are more similar to those observed for the agricultural LUSs than those observed for the urban LUSs, reflecting the predominance of agricul-tural areas sampled during the first phase of the NAWQA program.
The predominance of atrazine relative to prometon in shallow ground water beneath agricultural areas (fig. 7) is consistent with the primarily agricultural use of atrazine, whereas the predominance of prometon relative to atrazine in the urban areas reflects the primarily nonagricultural use of prometon. The relatively common occurrence of prometon in agricultural settings, however, suggests that pesticide applications for nonagricultural purposes (table 2) such as for treating pavement, fence rows, rights-of-way, and other commercial and residential areasmay still be relatively extensive in agricultural areas. (No nationwide data on prometon use are available to test this hypothesis, however.) The similarity in simazine detection frequencies between the agricultural and urban areas (fig. 7) is consistent with the fact that the nationwide use of this herbicide in nonagricultural settings is nearly as high as in agricultural locations (table 2).
The detections in urban areas of alachlor (albeit at a concentration of less than 0.01 µg/L, as noted in a later section) and cyanazine, herbicides with no known uses in nonagricultural settings (table 2), may have been the result of historical use, atmospheric deposition, or transport of the herbicides from nearby application areas, either in the air (through spray drift) or in ground water. The other three agricultural herbicides detected in the urban areas (atrazine, simazine, and metolachlor) may also have entered the shallow ground water by atmospheric or subsurface transport from nearby agricultural applications. Indeed, recent detections of alachlor, atrazine, cyanazine, and metolachlor in rainfall and stormwater runoff in a small urban watershed in Minneapolis, Minnesota, where none of these compounds had been applied (Capel and others, 1998), demonstrate that agricultural pesticides may be carried by atmospheric transport from nearby application areas into a watershed where they have not been used. However, because atrazine, simazine, and metolachlor are also used for nonagricultural purposes (table 2), the possibility that some of the detections of these compounds in the urban areas during the NAWQA LUSs could have resulted from their nonagricultural use near the sampled areas cannot be ruled out.
Figure 8 also shows the relative frequencies of herbicide detection among the NAWQA study components, but from a perspective different from that of figure 7. While figure 7 displays the frequencies of detection of each herbicide across all sites for a given study component (for example, all shallow ground water sampled in urban settings), figure 8 provides an indication of the variability in pesticide detection frequencies among the individual studies carried out for each study component. Indeed, figure 8 demonstrates that, for several of the herbicides in some of the study components, this variability was substantial.
During both the NAWQA and MWPS investigations, the detection of one of the pesticide compounds at an individual site was commonly accompanied by the detection of others. Two or more of the herbicides of interest were detected in ground water at 19.7 percent of the 2,227 sites sampled for NAWQA, and at 13.8 percent of the 94 wells sampled in 1992 for the MWPS (fig. 9). As shown in figure 9, the frequency distributions for multiple herbicide detections were similar between the two studies.
The specific combinations of pesticide compounds detected together in ground water were also similar between the two investigations. For both studies, the pair of compounds detected together most frequently consisted of atrazine and DEA, as shown in table 9. The fact that atrazine was one of the two pesticide compounds detected together most often was not unexpected because it was the pesticide detected most frequently by both studies. The observation that DEA was the other compound was also not surprising, for at least four reasons: (1) DEA is an atrazine degradate, (2) the two compounds have similar transport characteristics (Mills and Thurman, 1994), (3) DEA is relatively persistent in ground water, and (4) DEA was the second most frequently detected pesticide compound during both studies.
Other than the atrazine-DEA pair, the herbicides detected together most frequently during the NAWQA and MWPS investigations were those applied in both agricultural and nonagricultural settings (table 2)atrazine (and thus DEA), simazine, and metolachlor. Among the pesticides of interest, those detected least often with other compounds were the exclusively agricultural herbicides alachlor and cyanazine. These two herbicides may also have been detected less frequently with other compounds because of the more limited range of agricultural settings in which they are used (table 2) and their relatively low persistence (table 3). Data for acetochlor are not included in table 9 because sampling for it was carried out in only a subset of the wells sampled by NAWQA, and in none of the wells sampled in 1992 for the MWPS (table 4). Similarly, although 2,6-diethylaniline was examined during the 1992 MWPS sampling (table 6), the MWPS results are not shown for this alachlor degradate in table 9 because analyses for it were carried out on only a subset of the 94 wells sampled that year (Kolpin and others, 1996c).
The frequencies of detection of all the degradates examined for the seven herbicides during the NAWQA, MWPS, and CGAS investigations are summarized in table 11. (Data from the CGAS were included in the table because of the large number of degradates examined by this study.) The results are presented using varying reporting limits to facilitate comparisons among different compounds or different study components. To date, however, the investigation that has measured the concentrations of degradates in ground water for the largest number of herbicides was a 1996 statewide sampling of 88 municipal wells in Iowa by Kolpin and others (1998b). Results from this study are presented in table 12 to provide a broader analytical perspective on the occurrence of herbicide degradates in ground water, albeit within a smaller area than that covered by any of the multistate studies. For the purpose of comparison with other data presented in this report, table 12 also summarizes the detection frequencies for prometon and simazine, which were also included in the Iowa study, but for which no degradates were specifically examined. Both tables 11 and 12 demonstrate that, as will be discussed in greater detail below, the degradates for the herbicides of interest were, in many instances, detected in ground water above a given reporting level more frequently than their respective parent compounds.
The overall frequencies of detection at or above 0.01 µg/L for the five PMP herbicides in shallow ground water beneath urban areas during the NAWQA study were significantly correlated with their respective intensities of nonagricultural use across the Nation (R2=0.85; P=0.026; simple linear correlation), as shown in figure 10. (All statistical tests for this report were evaluated at a significance level [a] of 0.05.) Neither acetochlor nor prometon were included in this analysis because of the absence of quantitative data on their nationwide use in nonagricultural settings (table 2).
An estimate of agricultural use in each of the NAWQA LUS areas, available only for the five PMP herbicides, was obtained for each compound by adding together the estimated total amount of active ingredient applied to agricultural crops and pasture within a 1-kilometer radius surrounding each of the sampled sites for which use data were available, and summing use for all sites in each LUS area. These total use estimates were divided by the total area of the circles of 1-kilometer radius surrounding all of the sites to yield an average rate of use for each LUS area. Five sites were excluded from these computations because of a lack of data on agricultural use: two in albelus1 and one each in nvbrlusag1, rednlus2, and willlus2 (table 8). Although classified as an SUS, the cnbrsus1 investigation (table 8) was included among the studies examined for this analysis because it involved the sampling of shallow ground water in an area dominated by row-crop agriculture.
In agricultural areas, the relations between detection frequency at or above 0.01 µg/L in shallow ground water and intensity of agricultural use for the five PMP herbicides during the NAWQA study (fig. 11) were consistent with results from previous investigations (Barbash and Resek, 1996). Frequencies of detection were generally lower in areas of low use for all of the herbicides, whereas the highest detection frequencies were usually encountered in areas of more intensive use. However, areas with higher use also tended to show greater variability in detection frequencies than areas with lower use. Thus, in general, high use was a necessary, but not a sufficient condition for the frequent detection of an herbicide in shallow ground water beneath agricultural areas.
As is often the case for anthropogenic contaminants in environmental media, the frequencies of detection of most of the PMP herbicides among the different study areas were strongly skewed toward low values; the intensities of agricultural use in the individual study areas were also similarly distributed. Consequently, both parameters were subjected to a log (base 10) transformation in order to obtain distributions that more closely approximated normality before examining statistical correlations between occurrence and agricultural use for the NAWQA study. To accommodate this transformation, for each agricultural LUS where an herbicide was not detected at or above 0.01 µg/L, the detection frequency for the compound was assigned a value of 1 percent (smaller than the lowest nonzero detection frequency for any of the herbicides in any of the study areas) before the transformation was applied. Similarly, for every network in which the total agricultural use of a given herbicide within a 1-kilometer radius from all sampled sites was estimated to be zero, the agricultural use was assigned a value of 0.001 kg a.i./km2 (smaller than the smallest use value for any herbicide in any LUS network) to accommodate the log transformation. As noted earlier, any sites for which agricultural use data were not available were excluded from the univariate or multivariate statistical analyses.
Figure 11 indicates that atrazine (P=0.0028), and metolachlor (P=0.0006) have statistically significant linear correlations between their frequencies of detection in shallow ground water and their use in agricultural areas, whereas simazine, alachlor, and cyanazine do not (P>0.05; log-transformed variables). When these relations were examined from a nonparametric perspective, however, the rank correlations between detection frequency and agricultural use were found to be statistically significant (P<0.02; Spearman rank correlations) for all herbicides except simazine. Nevertheless, the considerable scatter in the data shown in figure 11, and the correspondingly low R2 values, indicate that herbicide detection frequencies in shallow ground water are governed by other factors in addition to use. Consequently, multiple regression analysis was used to explore the influence of other factors on herbicide detection frequencies.
Initial analysis of the NAWQA LUS results by Kolpin and others (1998a) indicated that among the 20 pesticides detected at or above 0.01 µg/L in shallow ground water beneath agricultural areas, the frequencies of detection were significantly related to the agricultural use and subsurface mobility (Koc) of the compounds (P<0.05; Spearman rank correlations), but not to their field dissipation half-lives (P>0.05). Through the use of multivariate correlations, the present report extends this analysis for the five PMP herbicides to examine the degree to which their detection frequencies in shallow ground water beneath agricultural areas were correlated with their agricultural use, Koc and aerobic soil half-lives (table 3), and with the median well depths of the sampled networks (table 8). As with the previous multivariate analysis of the NAWQA LUS data presented by Kolpin and others (1998a), and for the reasons noted earlier, these computations were carried out following log transformation of all variables.
The multivariate analysis indicates that the frequencies with which the PMP herbicides were detected in shallow ground water for the agricultural LUSs were significantly correlated with their agricul-tural use in the individual LUSs and their aerobic soil half-lives (P<0.0001 for each parameter), but not with Koc (P=0.19) or the median well depth of the sampled networks (P=0.72). Overall, variations in agricultural use and aerobic soil half-life accounted for 36 percent of the observed variability in PMP herbicide detection frequencies in shallow ground water among the agricultural LUSs (R2=0.36).
The nonsignificant relations with Koc and med-ian well depth were likely caused in part by the rela-tively narrow range spanned by both parameters (tables 3 and 8). The lack of significant correlation between detection frequencies and Koc during the multivariate analysis is in marked contrast to the significant, inverse relation observed by Kolpin and others (1998a) between the two parameters for the NAWQA LUS data. However, this contrast is not necessarily surprisingonly five herbicides were examined for the present case, with Koc values varying by only a factor of three (table 3), whereas Kolpin and others (1998a) examined all 20 pesticides detected at or above 0.01 µg/L in the agricultural LUSs, a set of compounds for which Koc values spanned more than two orders of magnitude. Similarly, as with the non-significant relation seen here between herbicide detection frequencies and the median depths of the wells in the sampled networks, a lack of a significant correlation between herbicide detection frequencies in near-surface aquifers and well depths during the first year of the MWPS was attributed by Burkart and Kolpin (1993) to the relatively narrow range of well depths examined. The relations between detection frequency and agricultural use for the PMP herbicides (fig. 11) illustrate the combined influence of persistence and use identified by the multivariate correlation results. Maximum frequencies of detection, most commonly observed in high-use areas, diminished with decreasing aerobic soil half-life among the five compounds. Furthermore, metolachlor, alachlor, and cyanazineagricultural herbicides with similar half-livesdisplayed similar relations between detection frequency and use over the range from 1 to 20 kg/km2.
Results from the statewide sampling of municipal wells in Iowa (table 12 and fig. 12) support the hypothesis that the relatively low frequencies with which cyanazine and the three acetanilides were detected in shallow ground water beneath agricultural areas during the NAWQA study, despite their high use in many of these areas, may have been related to the comparatively low persistence of these herbicides in soil. Figure 12 indicates that, to a first approximation, the more the reactive the herbicide (that is, the shorter its transformation half-life) in aerobic soil, the greater the frequency with which any of the degradates examined for that herbicide were detected in ground water during the Iowa study, relative to the detection frequency for the parent compound (all at or above 0.2 µg/L).
The absence of a significant correlation between detection frequency and use for simazine (fig. 11) was caused, in part, by its relatively high frequencies of detection in some of the study areas with low agricul-tural usea potential consequence of its extensive use in nonagricultural settings (table 2). Substantial non-agricultural use may also explain why atrazine was detected frequently in some areas with low agricultural use. Additionally, the relatively high frequencies of atrazine and simazine detection in two of the studies with the lowest use of both compounds (usnkluscr1 and usnkluscr2, encircled in fig. 11) may have resulted from the extensive irrigation employed in the Upper Snake River Basin, where these two studies were undertaken (table 8). Excluding the data from these two networks, however, did not affect the overall conclusions from any of the statistical analyses.
The fact that variations in persistence and agricultural use, in addition to well depth and pesticide mobility, accounted for less than 40 percent of the variability in detection frequencies observed in shallow ground water for the herbicides of interest during the NAWQA studies in agricultural areas demonstrates the need to incorporate a broader range of explanatory factors into this analysis. Future work with the NAWQA data will examine the effects of several additional parameters of interest in this regard, such as those related to hydrogeologic setting, soil properties, climate, and agricultural management practices (table 1).
Contrasts in the frequencies of herbicide detection reported by the different phases of the MWPS (using a common reporting limit of 0.05 µg/L to facilitate comparisons) suggest the potential influence of other factors, in addition to the properties and use of these compounds, on herbicide occurrence in ground water. Comparisons between the detection frequencies observed by the MWPS during the preplanting and postplanting samplings in 1991 (table 13 and fig. 13) indicated a general increase in the frequency of detection following planting for most of the compounds examined (Burkart and Kolpin, 1993), including all four of the triazine herbicides of interest to this report. Similarly, other studies have demonstrated that the likelihood of detecting pesticides in shallow ground water is generally highest during the first few weeks following application (Barbash and Resek, 1996).
The MWPS results also support the conclusion, reported by other investigators (Barbash and Resek, 1996), that pesticide detection frequencies in ground water increase with higher amounts of recharge. Results from sampling carried out for the MWPS in 1993, following the Mississippi River floods (Kolpin and Thurman, 1995), showed increases in the frequency of detection relative to the previous year for five of the herbicides of interest; essentially no change in detection frequency was observed for atrazine. Frequencies of detection of pesticides and other surface-derived contaminants in ground water might be expected to increase following extensive flooding because of the substantially higher rates of ground-water recharge that occur while the land surface is inundated. The increases in herbicide detection frequencies discussed above for the MWPS during the postplanting sampling in 1991, relative to the preplanting results (Burkart and Kolpin, 1993), may also have been caused in part by enhanced recharge from the spring rains.
Seasonal patterns of pesticide application and ground-water recharge from either precipitation or irrigation are also likely to have been responsible for seasonal fluctuations in pesticide detection frequencies observed during other investigations. Results from other studies indicate that frequencies of pesticide detection in shallow ground water beneath agricultural areas generally increase during late spring and early summer (after major agricultural applications and rainfall have occurred in many areas), diminish during late summer and autumn, and reach their lowest levels during the winter and early spring, after which the cycle repeats. These seasonal fluctuations in pesticide detection frequencies usually become more muted with increasing depth (Barbash and Resek, 1996).
The following sections summarize the principal results from the NAWQA and MWPS investigations, and selected results from the other multistate studies, for each of the seven herbicides of interest. For six of the herbicides (all except acetochlor), the discussion of the results from the USGS studies for each compound is accompanied by the following:
Data for acetochlor are not shown in these figures for two reasons. First, as discussed below, acetochlor was detected at only two sitesout of 953 sampled for itduring the NAWQA Program. Second, the 1992 sampling for the MWPS did not include analyses for acetochlor because use of the herbicide did not begin until 1994 (table 13). Of the six other parent compounds of interest, data on geographic patterns of agricultural use are shown only for the five PMP herbicides; as noted earlier, no such data are currently available for prometon.
The geographic distributions of agricultural use shown in the occurrence maps are based on the data from Gianessi and Anderson (1995) and are displayed in terms of the pounds of active ingredient (lb a.i.) applied annually per acre of harvested cropland and pasture within each county. As noted in previous presentations of these types of maps (Barbash and Resek, 1996; Larson and others, 1997), distortion can occur when use data are displayed on a countywide basis. In areas where pesticide applications take place in only a relatively small proportion of a given county, for example, the areal extent of application will be exaggerated on the map. This distortion can be particularly acute in areas such as the western United States, where counties tend to be larger than in other regions of the country.
As noted above, for each herbicide, geographic patterns of detection from the NAWQA Program are displayed on separate maps for the frequencies of detection and the 90th-percentile concentrations, superimposed in both cases (for the five PMP herbicides) over the distributions of agricultural use. Each sampling network is classified (by symbol shape) according to the four NAWQA study components of interest, and highlighted in bold outline where the sampled ground water represents a current or future source of drinking-water supply (table 8). Because many of the LUSs exhibit partial and, in some cases, complete geographic overlap with SUSs or other LUSs in some study units (for example, ccptlusag2 and ccptlusor1 - see table 8), several of the symbols have been moved to reduce or avoid overlap on the maps and, thus, are only approximate indicators of the actual study locations.
For each herbicide, detection frequencies and 90th-percentile concentrations in the individual NAWQA sampling networks are displayed in relation to the median value among all of the networks with one or more detections, using one of three colors: (1) not detected (blue); (2) detection frequency greater than zero, or 90th-percentile concentration greater than the detection limit, but either parameter less than the median value among all networks with detections (yellow); and (3) detection frequency or 90th-percentile concentration greater than or equal to the median value among all networks with detections (red). Apparent gaps between the legend categories for some of the detection-frequency and 90th-percentile concentration maps were a consequence of using the actual values involved (for example, 3.519 and 20100), rather than simply the median values alone (less than 20 and greater than or equal to 20). To determine percentiles for a particular study, all nondetections were treated as tied values below the lowest concentration measured; 90th-percentile concentrations in this range are denoted as not detected (blue) on the maps. The countywide use data are displayed in relation to the median intensity of agricultural use among all counties in the Nation with reported use of the compound: (1) no estimated countywide use (white); (2) countywide use greater than zero, but less than the median value among all counties with reported use (tan); and (3) countywide use greater than or equal to the median value (light brown). Figure 14 shows the various physiographic regions of the United States to which the discussions of use and occurrence patterns refer.
To provide the most complete picture of geographic variations in occurrence across the Nation for individual compounds, the frequencies of herbicide detection shown in the national maps summarizing the NAWQA results incorporate all of the detections for each herbicide and, thus, were not adjusted to a uniform reporting limit among all compounds (as was done, for example, for the data displayed in fig. 7 and table 13). Consequently, these maps cannot be employed to compare detection frequencies among different herbicides for a particular area; as noted earlier, such comparisons require that the detection frequencies be adjusted to a common reporting limit.
For six of the herbicides, separate maps show the concentrations measured in individual wells sampled in 12 states of the northern midcontinent in 1992 during the MWPS. (As noted earlier, acetochlor was not yet in use at the time of this sampling and therefore was not examined.) For consistency with the maps showing the NAWQA results, the concentrations measured in each of the MWPS wells are sorted into three categories for the purpose of display: (1) not detected at or above the original reporting limit for each herbicide (blue); (2) concentration greater than or equal to the reporting limit, but less than the median value among all wells with detections of that herbicide (yellow); and (3) concentration greater than or equal to the median value among all wells with detections (red). As with the NAWQA maps, the concentration data for the five PMP herbicides also are superimposed over displays of their countywide agricultural use across the MWPS study area, employing the same use data shown in the national maps for the NAWQA results. For the MWPS maps, however, the use data are displayed in relation to the median value among all of the counties with nonzero use in the 12-state study area, rather than across the entire Nation.
Atrazine was the herbicide detected most frequently for every study component of both NAWQA and the MWPS, with the exception of the shallow ground water examined by NAWQA in urban areas, where prometon was detected most often (table 13 and fig. 7). These findings are consistent with the use patterns for the two compounds. (The results for prometon will be discussed in the next section.) Of the seven herbicides examined, atrazine was used most extensively in the United States during the period of sampling (table 2 and fig. 1). Atrazine has also been the pesticide detected most frequently in ground water by several other large-scale studies, including the multistate NAWWS (Holden and others, 1992); statewide investigations in Illinois (Goetsch and others, 1992), Iowa (Kross and others, 1990), Kansas (Steichen and others, 1988), Minnesota (Klaseus and others, 1988), Missouri (Sievers and Fulhage, 1992) and Nebraska (Exner and Spalding, 1990); and provincewide studies in Ontario, Canada (Rudolph and others, 1992, 1993).
Figure 15 shows a striking similarity between the results from the NAWQA LUSs in agricultural areas and those from the 1992 MWPS with respect to the frequencies of atrazine detection in shallow ground water, regardless of reporting limit. This is consistent with the focus by both study components on relatively shallow ground water in areas dominated by agricultural activities. Frequencies of atrazine detection by NAWQA were considerably lower in urban areas, as might be expected from the primarily agricultural use of the herbicide (table 2). Throughout most of the concentration range examined, detection frequencies in drinking-water aquifers were intermediate between those in the urban and agricultural areas during NAWQA (fig. 15), reflecting the fact that the drinking-water aquifers were sampled in areas with a mixture of the two land-use settings. The NAWWS detected atrazine with a frequency nearly identical to that observed at the same reporting limit by NAWQA in drinking-water aquifers. The NPS, however, detected atrazinein either rural domestic or community supply wellswith a frequency considerably lower than that observed by any of the other studies, perhaps because the NPS focused on a much broader range of land-use settings and well depths. In contrast, the frequency with which atrazine was detected at or above 0.1 181;g/L during the CGAS was much higher than what was observed by the other studies for this reporting limit, probably because the CGAS specifically targeted wells in which atrazine detections would be more likely (table 7). A similar phenomenon was observed for metolachlor, as discussed in greater detail for both herbicides in a later section.
Agricultural use of atrazine (fig. 16A) is most intensive (that is, countywide use is at or above the national median) in the High Plains, Central Lowland, Appalachian and Interior Low Plateaus, New England, and the Coastal Plain, but its widespread use in both agricultural and nonagricultural settings throughout most of the Nation led to its detection in nearly every NAWQA network sampled in most regions. Frequencies of detection and upper 90th-percentile concentrations (fig. 16B) were relatively high in high-use areas, in urban as well as agricultural settings, with the pattern being more pronounced in southern New England and the northeastern areas of the High Plains, Central Lowland, Appalachian Plateau, and Valley and Ridge Province than in most of the sampled areas of the Coastal Plain. In contrast, figure 16 indicates that the atrazine detections in areas with lower use, such as the southern Great Basin, southeastern Basin and Range province, Southern Rocky Mountains, northwestern Central Lowland, and western Coastal Plain, were generally at low concentrations, with upper 90th-percentile concentrations often below detection.
Comparisons between use and occurrence at a finer spatial scale in the northern midcontinent, on the basis of the MWPS data (fig. 17), indicate only moderate correspondence between the intensity of atrazine use and atrazine concentrations measured in ground water. While the highest concentrations were usually encountered in areas of highest use, many other wells sampled in high-use areas had no detections. Infrequent detections, despite high use, were particularly common in Indiana and Illinois during the MWPS for atrazine, as well as for the other four PMP herbicides. Previous studies in Illinois have also noted this pattern (Barbash and Resek, 1996), which may be related to the widespread occurrence of low-permeability geologic materials close to the land surface within the state (McKenna, 1990), or to the resulting pervasive use of subsurface drains. A much closer correspondence between atrazine detections and use, however, was observed in Ohio, where use is comparatively intensive and most of the sampled wells contained detectable, albeit low concentrations. This correspondence in Ohio was also seen for simazine, but not for the other three PMP herbicides.
Deethylatrazine (DEA), a major atrazine degradate, was detected in ground water about as frequently as its parent compound in nearly every study component of the NAWQA, MWPS, CGAS (table 11) and Iowa statewide well investigations (table 12). (Both the frequencies of detection and the concentrations may have been underestimated for DEA during the NAWQA study, however, because the analytical recoveries for DEA were considerably lower than those for atrazine.) Another atrazine degradate, deisopropylatrazine (DIA), was detected less frequently than either atrazine or DEA during both the MWPS and the CGAS. Laboratory and field studies indicate, however, that the principal degradate of atrazine is hydroxyatrazine, produced from the hydrolysis of the parent compound (Armstrong and others, 1967). Although hydroxyatrazine was detected during both the CGAS (table 11) and the statewide sampling of Iowa ground water (table 12), its frequency of detection was substantially lower than those for atrazine or DEA during both studies, perhaps because of the strong affinity hydroxyatrazine exhibits toward clays and other soil surfaces (Armstrong and Chesters, 1968; Schiavon, 1988; Loch, 1991; Demon and others, 1994).
Nationwide use data are not currently available for prometon, but the higher frequency of its detection in shallow ground water beneath urban areas relative to agricultural areas (figs. 7 and 18) is consistent with the predominantly nonagricultural use of this nonselective herbicide. Comparisons with the findings of Whitmore and others (1992) indicate that the relative frequencies of detection of prometon and atrazine in the urban areas during the NAWQA study (fig. 7) parallel their relative frequencies of use in residential settings in 1990 (that is, 1,281,000 outdoor applications of prometon, as opposed to 477,000 for atrazine).
Several additional lines of evidence support a close association between prometon occurrence in ground water and urban land use. The frequency of prometon detection during each of the NAWQA LUSs was significantly correlated (P=0.042; Spearman rank correlation) with the median percentage of urban land within 1 km of the sampled wells (Kolpin and others, 1998a). During the 1991 sampling for the MWPS, 80 percent of the prometon detections in ground water occurred within 400 m of residential areas or within 3.2 km of golf courses; in comparison, only 36 percent of the other herbicide detections occurred in these areas (Burkart and Kolpin, 1993). Similarly, prometon was detected more frequently in shallow ground water in urban areas than in nonurban (primarily agricultural and forested) areas in central Oklahoma by Christenson and Rea (1993), and in the Albemarle-Pamlico, Lower Susquehanna, and Potomac River Basin study units and surrounding areas by Ator and Ferrari (1997). A correlation between prometon detections and urban (residential) land use was also reported by Land (1996) for surface waters in the Trinity River Basin study unit.
Figure 18 indicates that, unlike any of the other six herbicides examined, prometon was detected much more frequently in urban areas sampled by NAWQA than in areas with either agricultural or mixed land use. As with atrazine (fig. 15), the MWPS results for prometon more closely approximated the NAWQA findings in agricultural areas than those for the urban settings. Consistent with its focus on drinking-water supplies, the NPS detected prometon at about the same frequency as did the NAWQA studies of DWAs (that is, the SUSs).
The distribution of prometon detections in ground water during the NAWQA Program (fig. 19) cannot be compared with spatial patterns of its application because, once again, county-level use data are not available. However, consistent with its primarily nonagricultural use, prometon was detected in shallow ground water in a considerably higher proportion of the studies done in urban settings than in areas with agricultural or mixed land use. While many of the studies done in agricultural or mixed land-use areas had no prometon detections (fig. 19A), the herbicide was detected in every urban area examined by the NAWQA studies except for the urban LUSs undertaken in the Willamette and Hudson River basins. Prometon was not widely detected by the MWPS in 1992 (fig. 20) but, as noted earlier, the wells in which it was detected during the 1991 MWPS sampling were substantially over-represented near residential areas and golf courses (Burkart and Kolpin, 1993).
As with figure 7, the NAWQA data shown in figure 21 reflect the similar levels of simazine use in both agricultural and nonagricultural settings (table 2). Indeed, although the herbicide was detected more frequently in agricultural than in urban areas for concentrations below 0.07 µg/L, figure 21 indicates that areas where it was detected above this concentration during the NAWQA studies were more likely to be in urban than in agricultural or mixed land-use settings. The NAWWS detected simazine at a frequency nearly identical to that observed by the MWPS at or above 0.03 µg/L, consistent with the focus of both studies on agricultural areas. The low frequencies of simazine detection at or above 0.4 µg/L by the NPS are close to what would have been expected on the basis of the NAWQA results.
Observations regarding patterns of agricultural use for simazine (fig. 22) must be qualified by what appear to be inconsistencies in the nature of the data from one state to anothera difficulty occasionally evident for the agricultural use data in various parts of the country for each of the PMP herbicides. This limitation notwithstanding, however, agricultural use of simazine is extensive throughout most of the region east of the Mississippi River, with the exception of Wisconsin, Maine, Vermont, Mississippi, Alabama, northern Georgia, and northern Florida. Simazine use is also comparatively high in California, Oregon, Washington, and Idaho, largely as a consequence of its extensive application to orchards, vineyards, and alfalfa.
Although many of the NAWQA sampling networks in high-use areas for simazine had relatively high frequencies of simazine detection, figure 22A indicates that several networks in low-use areas also exhibited high detection frequencies, such as those in the western Great Basin, northern Colorado, central Nebraska and the northwestern Central Lowland. In most of the Southern Rocky Mountains and southeastern Basin and Range Province, both use and detections were sparse, but detections were also infrequent for some of the networks sampled in higher-use areas of the eastern and southeastern Coastal Plain. Simazine concentrations (fig. 22B) were also generally low throughout most of the sampled areas in the Basin and Range Province, Southern Rocky Mountains, Central Lowland, southern New England, and the Coastal Plain. Consistent with the findings reported for a previous USGS study by Domagalski and Dubrovsky (1991), simazine was frequently detected in the Central Valley of California, an observation attributed by the earlier authors to its extensive use along roadways, as well as in vineyards and other agricultural settings.
As with the nationwide results from NAWQA, pronounced geographic disparities between simazine use and detections in ground water were evident for the MWPS (fig. 23). Although simazine was not detected in the northern central parts of the study area, where its use is minimal, detections were also rare in Illinois and Indiana, where use is high. (As with the NAWQA data, however, comparisons between occurrence and use for the MWPS results are complicated by apparent inconsistencies in the nature of the use data from one state to another.) The infrequent detections of simazine in Illinois, despite considerable use, echo similar findings from the MWPS for the other PMP herbicides, as discussed earlier for atrazine. Also consistent with the atrazine results was the relatively close correspondence between high simazine use and detections in Ohio. Although, as noted earlier, this pattern was not seen in Ohio for the other three PMP herbicides (alachlor, cyanazine, and metolachlor), the data in tables 11 and 12 suggest that the MWPS results for one or more of the principal degradates of these other herbicides may provide a more complete picture of their effects on ground-water quality.
As was observed for atrazine, the frequencies of metolachlor detection during the MWPS closely matched those encountered in agricultural areas during the NAWQA study throughout most of the concentration range examined (fig. 24). Also consistent with the atrazine results was the similarity between the frequency of metolachlor detection during the NAWWS and that observed in DWAs during NAWQA, once again in agreement with the NAWWS focus on domestic water supplies. As with prometon and simazine, the low frequency of metolachlor detection during the NPS is consistent with the NAWQA data, given the relatively high reporting limit used during the earlier study.
The frequency of metolachlor detection shown in figure 24 for the Metolachlor Monitoring Study, or MMS (Roux and others, 1991a), is much higher than would have been anticipated from any of the other multistate studies that sampled for this herbicide, a pattern also noted earlier for atrazine during the CGAS (fig. 15). These findings illustrate the effect of targeted sampling on observed detection frequencies (Barbash and Resek, 1996). In contrast with the stratified random site-selection approaches employed by the other multistate studies examined in figures 15 and 24, the MMS was specifically designed to focus on hydrogeologically vulnerable areas with extensive metolachlor use, whereas the CGAS focused on vulnerable areas with known atrazine contamination (table 7). These approaches led to frequencies of detection of the targeted herbicides that were much higher than those encountered for the same reporting limit by the other multistate studies. Such observations underscore the importance of accounting for variations in study design when comparing the results from different investigations.
As with atrazine, the areas of highest agric-ultural use of metolachlor in the Nation are in the High Plains, Central Lowland, Appalachian Plateau, Interior Low Plateau, New England, and eastern and south-western Coastal Plain (fig. 25A). Metolachlor use is also relatively high within the Mississippi Alluvial Plain. In marked contrast with the findings for atrazine and simazine, however, the spatial patterns of metolachlor detection across the Nation during the NAWQA studies align relatively closely with the geographic distribution of its agricultural use (fig. 25), consistent with the highly significant correlation noted earlier between its detection frequency and the intensity of its application in agricultural areas (fig. 11). With only a few exceptions (mostly in the west), most of the NAWQA networks with high frequencies of metolachlor detection were in areas of high agri-cultural use. Furthermore, all of the exceptions to this patternthat is, where the herbicide was detected frequently despite lower usewere in agricultural areas, where metolachlor was most likely to have been used, albeit at rates lower than the national median. High frequencies of metolachlor detection were also encountered in several areas of urban and mixed land use. As discussed earlier, this pattern may have been the result of input from nearby agricultural areas, particularly given that (1) it was only observed in regions of high agricultural use and (2) the majority of areas where metolachlor was not detected at all, regardless of land-use setting, were in areas of low agricultural use. P> The relatively close correspondence observed in the NAWQA data between the occurrence and agricultural use of metolachlor is not reflected in the results from the MWPS (fig. 26). Although all of the detections of metolachlor occurred in high-use areas, the herbicide was rarely detected throughout most of the high-use areas sampled. This is in agreement with the patterns observed for atrazine and simazine in Illinois and Indiana, but not in Ohio, where the other two herbicides were detected relatively frequently (figs. 17 and 23). On the basis of the conclusions from the multivariate correlation analysis, this disparity between the metolachlor results and those for atrazine and simazine in Ohio may have been caused by the fact that metolachlor is considerably less persistent than the other two compounds (table 3). This hypothesis is supported by the relative frequencies with which the major degradates of metolachlor and atrazine were detected by Kolpin and others (1998b), relative to their respective parent compounds, in ground water in Iowa (table 12 and fig. 12).
Like the other two acetanilide herbicides discussed in this report (alachlor and acetochlor), metolachlor is readily transformed by soil micro-organisms to its respective ethanesulfonic acid (ESA) and oxanilic acid (OA) degradates. These products probably result from the displacement of the chlorine atom on the parent compounds by glutathione, fol-lowed by the formation of the ESA and OA degradates by different enzymatic pathways (Field and Thurman, 1996). The statewide sampling in Iowa during the summer of 1996 (table 12), discussed earlier, led to detections of the ESA and OA degradates for all three of the acetanilide herbicides discussed here. For each of these acetanilides, the relative frequencies of detection among parent and degradates (all adjusted to a common reporting limit of 0.20 µg/L) exhibited the same pattern, with ESA being detected most often, and the parent compound least often. During the Iowa statewide sampling, metolachlor ESA was detected at or above 0.20 µg/L more than seven times as frequently, and metolachlor OA nearly three times as frequently, as metolachlor itself (table 12).
Despite its considerable use in agricultural settings (table 2), alachlor was detected infrequently by the multistate studies (fig. 27), and at fewer than 10 percent of the sites sampled in most of the NAWQA ground-water networks (fig. 28). The low frequencies of detection by the NAWWS and NPS were in close agreement with the NAWQA results (fig. 27); alachlor detection frequencies during the MWPS were somewhat higher than those reported by the other investigations because of a relatively small number of detections in high-use areas.
The distribution of agricultural use of alachlor across the Nation (fig. 28) is similar to that of the other PMP acetanilide, metolachlor. Areas of highest use are primarily in the eastern Colorado Plateaus, High Plains, Central Lowland, northern Appalachian Plateaus, Adirondack and northern Piedmont provinces, St. Lawrence Valley, eastern Coastal Plain, and Mississippi Alluvial Plain. Consistent with the exclusively agricultural use of alachlor (table 2), most of the NAWQA sampling networks with detections of the herbicide were in agricultural areas with high use; alachlor was detected in only one of the urban LUSs (fig. 28A). As suggested earlier for this and the other exclusively agricultural herbicides, the detections of alachlor in this urban area may have been caused by either atmospheric or subsurface transport from nearby agricultural applications. Although some of the wells with alachlor detections during the MWPS (fig. 29) were located in regions of more intensive use, most of the high-use areas sampled, particularly those toward the east, had no detections.
As with metolachlor, the relatively low frequencies with which alachlor has been detected in ground water during the two USGS multistate studies, despite its substantial use in many of the sampled areas, may be related to its comparatively high rate of transformation in aerobic soil (table 3). This hypothesis is supported by the statistically significant correlation observed (and discussed earlier) between herbicide detection frequencies and aerobic soil half-life for the NAWQA data, and by the considerably higher frequencies with which the two principal products of alachlor transformation have been detected in ground water, relative to the parent compound (tables 11 and 12, and fig. 12). As with the other two acetanilides examined (metolachlor and acetochlor), these products are the corresponding ethanesulfonic acid (alachlor ESA) and oxanilic acid (alachlor OA).
Calculations using the data provided by Kolpin and others (1996c) indicate that during the MWPS, alachlor ESA was detected at or above 0.10 µg/L in ground water 15 times more frequently than alachlor in 1993, and 25 times more frequently than alachlor in 1994. During the statewide sampling of ground water in Iowa, alachlor ESA was detected at or above 0.20 µg/L nearly 50 times as frequently as alachlor itself (table 12). Similarly, a more compound-specific chemical analysis by Baker and others (1993) of some of the samples collected and analyzed during the Cooperative Private Well-Testing Program, or CPWTP (table 4), indicated that most of the immunoassay detections originally attributed to alachlor during the CPWTP may actually have been caused by the presence of alachlor ESA, rather than the parent compound. In addition to alachlor ESA, results from the Iowa statewide sampling indicate that alachlor OA may also be detected in ground water more frequently than its parent compound; during the Iowa study, alachlor OA was detected at or above 0.20 µg/L nearly 20 times as frequently as alachlor (table 12). Another alachlor degradate, 2,6-diethylaniline, was also detected in ground water by both the NAWQA and MWPS investigations (table 11), but the MWPS data indicate that it is much less commonly encountered than alachlor ESA.
Frequencies of cyanazine detection were consistently low for all of the multistate studies that examined its occurrence, the results from the NAWWS and NPS investigations showing close agreement in this regard with those from NAWQA and the MWPS (fig. 30). Agricultural use of this herbicide (fig. 31A) is most intensive in the Central Valley of California, the southeastern Basin and Range Province, the High Plains, the central and eastern parts of the Central Lowland, the northeastern parts of the Appalachian Plateaus and the Valley and Ridge and Piedmont provinces, the Adirondack province, the St. Lawrence Valley, New England, most of the southeastern Coastal Plain except for Florida, and the Mississippi Alluvial Plain.
In accord with the exclusively agricultural use of cyanazine (table 2), most of the NAWQA studies that detected the herbicide in ground water were located in regions of high agricultural use (fig. 31A), although the detections occurred at relatively low concentrations (figs. 30 and 31B). While several of the studies with cyanazine detections were in urban settings, as noted earlier these detections might have been the result of atmospheric or subsurface transport of the herbicide from applications in nearby agricultural areas. The MWPS results for cyanazine (fig. 32) were consistent with these results, with few detections, even in areas of high use.
As with alachlor, the low frequencies of cyanazine detection, even in areas where its agri-cultural use is considerable, may be a result of its comparatively rapid rate of transformation in aerobic soil (table 3). This hypothesis is supported by the relatively high frequency with which one of its prin-cipal degradates, cyanazine amide, was encountered in ground water in the northern midcontinent; this compound was detected in ground water at or above 0.05 µg/L nearly five times as frequently as cyanazine during the MWPS (table 11), and more than 10 times as frequently as cyanazine at or above 0.20 µg/L during the statewide sampling in Iowa (table 12 and fig. 12). The low rates of detection for cyanazine may also have been partly a result of voluntary reductions in its use over the past decade.
At present, the use of acetochlor is restricted largely to the corn-growing areas of the Central Lowland and northern High Plains, with some addi-tional use in Oregon and Delaware. Analyses for acetochlor were carried out at 953 of the sites sampled for the NAWQA study (table 4), but the herbicide was detected in only two locations; one well sampled for the cnbrsus1 study in central Nebraska (see table 8) with a concentration of 0.11 µg/L, and one well sampled for the nvbrlusag2 study in the Carson Desert of western Nevada with a concentration of 0.023 µg/L. These detections occurred in areas where the herbi-cide was known to have been used (Gianessi and Anderson, 1995). No acetochlor was detected at or above 0.05 µg/L in any of the 38 wells sampled for the MWPS during the summer of 1994 (table 13).
The low frequencies of detection reported for acetochlor are consistent with the fact that sampling for the herbicide by the USGS studies took place relatively soon after it was first registered for use in the United States in 1994. Indeed, differences in the timing of sampling relative to the first applications of acetochlor may explain why it was not detected at or above 0.05 µg/L in shallow ground water by the MWPS during the summer of 1994, but was detected above this concentration in shallow ground waterthough not in deeper aquifersby Kolpin and co-workers during statewide sampling in Iowa in the summer of 1995 (Kolpin and others, 1997) and the summer of 1996 (table 12). These findings agree with results from several field studies, discussed by Barbash and Resek (1996), indicating that some pesticides may reach shallow ground water in detectable concentrations within the first year following their application.
As noted earlier for alachlor and cyanazine, however, the low frequencies of acetochlor detection in ground water may also be related to its compara-tively high rate of transformation in soil (table 3), a point noted previously by Kolpin and others (1996a) for the northern midcontinent. As with alachlor and cyanazine, this hypothesis is supported by the high frequencies of detection of acetochlor degradates, relative to the parent compound, during the statewide sampling in Iowa by Kolpin and others (1998b); acetochlor ESA was detected at or above 0.20 µg/L over eight times as frequently, and acetochlor OA more than three times as frequently, as the parent compound during the Iowa study (table 12).
Because pesticides were usually detected at relatively low concentrations, drinking-water criteriathat is, those established for the protection of human healthwere rarely exceeded in ground-water samples collected during the USGS investigations. Among the seven herbicides of interest to this report, maximum contaminant levels (MCL), which are legally enforceable standards, have been set for only atrazine, simazine, and alachlor (fig. 33). Of the four other herbicides, lifetime health-advisory levels (HAL), which are nonenforceable guidelines, have been established for cyanazine, prometon, and metolachlor; to date, neither an MCL nor an HAL have been set for acetochlor. These criteria (MCL or HAL) were exceeded only for atrazine during the NAWQA study (fig. 33), at two of the 2,227 sites sampled. No drinking-water criteria for any of these herbicides were exceeded during the 1992 phase of the MWPS. For the NAWQA investigation, both of the sampling sites where the MCL for atrazine (3 µg/L) was exceeded were shallow (LUS) wells. One was located in an agricultural area; the other was a well used for drinking water in an urban area.
Criteria for Assessing Overall Health Risks Comparisons of pesticide concentrations measured in the hydrologic system with criteria established for the protection of drinking-water quality provide an initial approximation of the level of concern that might accompany the detection of these compounds in water resources. However, the low frequencies of drinking-water criterion exceedance observed during the USGS studies discussed here may underestimate the overall health risks associated with the presence of these pesticides and degradates in shallow ground water for several reasons. First, water-quality criteria for the protection of human health have been established for only a relatively small number of all pesticides registered for use. For example, as noted earlier, among the seven herbicides of interest, enforceable standards (MCLs) have been established for only three (fig. 33); HALs, which have been specified for three of the other herbicides, are guidelines recommended for use in the absence of regulatory limits (Nowell and Resek, 1994). Second, the drinking-water criteria consider only the effects of individual pesticides and do not account for the additional effects of other pesticides or degradates that might be present. As shown earlier in and table 9, detections of more than one pesticide at a given site were relatively common during both the NAWQA and MWPS investigations, and recent research has indicated that some combinations of pesticide compounds may show additive or even synergistic toxicity (Marinovich and others, 1996; Thompson, 1996). Third, other pesticide compounds not examined by either study, including degradates of several of the parent compounds that were invest-igated, have been detected in ground water (for example, Potter and Carpenter, 1995; Barbash and Resek, 1996; Barrett, 1996; Kolpin and others, 1997, 1998b) that could also cause adverse health effects (for example, Kauffman and Kearney, 1970; Babic-Gojmerac and others, 1989; Tessier and Clark, 1995; Bain and LeBlanc, 1996; Reddy and others, 1997). Finally, drinking-water criteria do not account for potential impacts on the health of aquatic ecosystems into which contaminated ground water may discharge (for example, Squillace and others, 1993; Kim and Hemond, 1998).
As part of an effort to initiate and develop Pesticide Management Plans (PMPs) for selected pesticides, the U.S. Environmental Protection Agency is currently evaluating information regarding the occurrence and distribution of five high-use herbicides in ground water of the United Statesatrazine, cyanazine, simazine, alachlor, and metolachlor. (At the time of writing, however, the removal of cyanazine from this list was under consideration.) This report provides an overview of data on detections in ground water for these five compounds, along with two chemically related herbicides (prometon and aceto-chlor), primarily on the basis of the results from two recent multistate studies by the U.S. Geological Survey (USGS)the National Water-Quality Assessment (NAWQA) Program and the Midwest Pesticide Study (MWPS). These two investigations detected the five PMP herbicides and prometon in drinking-water aquifers and other shallow ground water in a variety of agricultural and nonagricultural settings across the Nation. Acetochlor, the use of which began in 1994 in the United States, was detected at only two of the 991 sites sampled for the herbicide by the two programs through 1995; its detection within this time period, however, supports the observation from previous studies that pesticides can sometimes be detected in ground water within the first year following their application.
Consistent with the results from previous large-scale studies of pesticide occurrence in ground water, more than 98 percent of the pesticide detections during these USGS studies were at concentrations less than 1 µg/L. Consequently, criteria for the protection of drinking-water quality were rarely exceeded. However, these guidelines may underestimate overall health risks because they (1) have been established for only a relatively small number of pesticides, (2) do not account for additive or synergistic effects among combinations of pesticides, (3) neglect the potential toxicity of pesticide degradates, and (4) do not consider effects on aquatic ecosystems influenced by ground-water discharge. Multiple pesticide detections at individual sampling locations were common during the USGS studies; among all of the sites examined in this report for the NAWQA and MWPS investigations, 19.7 and 13.8 percent, respectively, had detections of two or more of the seven herbicides. Furthermore, degradates were detected frequentlyin many cases, more often than their parent compounds.
The likelihood of detecting a particular pesticide in ground water is dependent upon a broad range of natural and anthropogenic factors (for example, climate, soil properties, hydrogeologic setting, well construction, pesticide properties, rates of pesticide use, and other agricultural management practices), as well as study design. The examination of relations between these factors and pesticide occur-rence in ground water during the NAWQA Program is being carried out in a stepwise fashion. After correcting for many of the confounding effects of study design (through the use of consistent procedures for well selection, sampling and chemical analysis across the Nation, and a common analytical reporting limit among the compounds examined), the first factor examined in this regard was pesticide use. Limitations on the available data on use, however, restricted this analysis to the five PMP herbicides, on the basis of nationwide use estimates for nonagricultural settings, and county-level use estimates for agricultural areas.
Frequencies of detection in shallow ground water beneath urban areas during the NAWQA study were significantly higher for the PMP herbicides with greater nonagricultural use nationwide (P=0.026; simple linear correlation). In agricultural settings for both the NAWQA and MWPS studies, the frequencies of PMP herbicide detection in shallow ground water were generally higher in areas of more intensive agricultural use, but the strength of this relation varied considerably among different compounds and different regions of the country. Of the five PMP herbicides, statistically significant relations between agricultural use and the frequency of detection at or above 0.01 µg/L in shallow ground water beneath agricultural areas during NAWQA, on the basis of simple linear correlations of log-transformed parameters, were observed only for metolachlor (P=0.0006) and atrazine (P=0.003). Nonparametric correlations between detection frequency and use in agricultural settings were statistically significant (P<0.05; Spearman rank correlations) for all of the PMP herbicides except for simazine. The absence of statistically significant relations between occurrence and use for simazine was caused largely by the fact that it was detected at relatively high frequencies in areas where its reported agricultural use was low or zero, perhaps because of substantial use in nonagric-ultural settings or, in at least two of the study areas, extensive irrigation.
Frequencies of alachlor and cyanazine detection in many agricultural areas were considerably lower than would have been anticipated from their extensive agricultural use in these settings. The comparatively rapid rates at which both herbicides undergo trans-formation in aerobic soils, coupled with the frequent occurrence of their degradates in ground water, suggest that the infrequent detections of these herbicides may have been a reflection of their relatively low environmental persistence. The infrequent detections of acetochlor may also have been caused by its low field persistence, but an alternate explanation for the low detection rates for this herbicide is that its use did not begin until 1994, after the NAWQA sampling had commenced. The observation of a highly significant linear correlation between detection frequency and agricultural use for metolachlordespite an aerobic soil half-life comparable to those for alachlor and cyanazine, which did not show such a relationmay have been a statistical consequence of the considerably higher use of metolachlor in many of the study areas.
The examination of relations between PMP herbicide detections in shallow ground water and the various natural and anthropogenic factors with which such detections may be associated was extended beyond agricultural use through a multiple correlation analysis of the NAWQA results involving a subset of these factors. The frequencies of detection of the five PMP herbicides in shallow ground water beneath the agricultural areas were significantly correlated with their agricultural use in each of the sampled areas and with their aerobic soil half-lives (P<0.0001 for both parameters), but not with the predicted mobilities of the compounds in ground water (as approximated by their soil organic carbon partition coefficient, or Koc; P=0.19) or the median well depths of the sampled networks (P=0.72).
The highly significant correlation between detection frequency and aerobic soil half-life is consistent with the aforementioned hypothesis that the infrequent detections of alachlor and cyanazine, particularly in areas of high agricultural use, may have been a result of their comparatively low persistence in soil. The absence of significant relations with well depth or Koc was attributed to the relatively narrow range examined for both of these parameters. In addition to these effects, results from the MWPS and other investigations also indicate that frequencies of detection are generally higher following periods of pesticide application or enhanced recharge.
The fact that variations in pesticide persistence and agricultural use accounted for less than 40 percent of the variability in the frequencies of PMP herbicide detection in shallow ground water beneath agricultural areas demonstrates the need to incorporate other para-meters into this analysis. Future examination of the NAWQA data will involve consideration of additional natural and anthropogenic factors associated with pesticide detections in ground water, including those relating to soil properties, hydrogeologic setting, climate, and agricultural management practices.
The observations from these studies underscore the need for more detailed information on pesticide use and on the occurrence of pesticide degradates in ground water. Limitations on current information regarding the spatial distributions of pesticide use in the United States, particularly for pesticide applications in nonagricultural settings, may have contributed to the relatively poor geographic correspondence often seen between herbicide detections and use across the Nation during the multistate USGS studies. The limited data on the occurrence of selected degradates for some of the herbicides provided a more complete picture of the effects of pesticide use on ground-water quality, indicating that for several of the herbicides examined, particularly those that are less persistent, some degradates may be detected considerably more frequently than their parent compounds. Chemical analyses during ground-water monitoring studies should, therefore, routinely include the major degradates for the parent compounds of interest, especially for those pesticides that are more reactive. The incorporation of more explanatory factors, as well as refinements in the data on pesticide use and more extensive coverage of degradates, will help advance current understanding of how environmental and land-use setting influence the likelihood of detecting pesticides in ground water after they are applied to the land.
The authors would like to thank all the members of the NAWQA study units for selecting and installing the sampling sites, collecting the water samples, furnishing the pesticide data used from the NAWQA study, and providing local expertise on their particular study area. The authors would also like to thank Bernard Tom Nolan and George Groschen of the USGS for providing valuable comments during the USGS review process, and Arty Williams, Charles Evans, and John Simons of the USEPAs Office of Pesticide Programs for their additional input. The work of Susan Davis, Glenn Schwegmann, and Yvonne Gobert in the preparation of the text, tables, and illustrations, is also greatly appreciated.
Aller, Linda, Bennet, T., Lehr, J.H., Petty, R., and Hackett, G., 1987, DRASTIC: A standardized system for evaluating ground water pollution potential using hydrogeologic settings: Robert S. Kerr Environmental Research Laboratory, U.S. Environmental Protection Agency Report EPA/600/2-87/035, 622 p.
Andrilenas, P.A., 1974, Farmers use of pesticides in 1971Quantities: U.S. Department of Agriculture, Economic Research Service, Agricultural Economic Report 252, 56 p.
Armstrong, D.E. and Chesters, Gordon, 1968, Adsorption catalyzed chemical hydrolysis of atrazine: Environmental Science and Technology, v. 2, no. 9, p. 683689.
Armstrong, D.E., Chesters, Gordon, and Harris, R.F., 1967, Atrazine hydrolysis in soil: Soil Science Society of America Proceedings, v. 31, no. 1, p. 6166.
Ator, S.W. and Ferrari, M.J., 1997, Nitrate and selected pesticides in ground water of the Mid-Atlantic Region: U.S. Geological Survey Water-Resources Investigations Report 97-4139, 8 p.
Babic-Gojmerac, T., Kniewald, Z., and Kniewald, J., 1989, Testosterone metabolism in neuroendocrine organs in male rats under atrazine and deethylatrazine influence: Journal of Steroid Biochemistry and Molecular Biology, v. 33, p. 141146.
Bain, L.J. and LeBlanc, G.A., 1996, Interaction of structurally diverse pesticides with the human MDR1 gene product P-glycoprotein: Toxicology and Applied Pharmacology, v. 141, no. 1, p. 288298.
Baker, D.B., Bushway, R.J., Adams, S.A., and Macomber, Carol, 1993, Immunoassay screens for alachlor in rural wells: False positives and an alachlor soil metabolite: Environmental Science and Technology, v. 27, no. 3, p. 562564.
Baker, D.B., Wallrabenstein, L.K., and Richards, R.P., 1994, Well vulnerability and agrichemical contamination: Assessments from a voluntary well testing program, in Weigmann, D.L., ed., New directions in pesticide research, development, management, and policy: Proceedings of the Fourth National Conference on Pesticides: Blacksburg, Va., Virginia Polytechnic Institute and State University, Virginia Water Resources Center, p. 470494.
Balu, K., Holden, P.W., Johnson, L.C. and Cheung, M.W., 1998, Summary of Ciba Crop Protection groundwater monitoring study for atrazine and its degradation products in the United States, in Ballantine, L.G., McFarland, J.E., and Hackett, D.S., eds., Triazine herbicides risk assessment: American Chemical Society Symposium Series, v. 683, p. 227238.
Barbash, J.E., 1996, Pesticides in ground water: Current understanding of distribution and major influences: U.S. Geological Survey Fact Sheet FS-95-244, 4 p.
Barbash, J.E. and Resek, E.A., 1996, Pesticides in ground water: Distribution, trends, and governing factors: Chelsea, Mich., Ann Arbor Press, Pesticides in the Hydrologic System series, v. 2, 588 p.
Barrett, M.R., 1996, The environmental impact of pesticide degradates in groundwater, in Meyer, M.T., and Thurman, E.M., eds., Herbicide metabolites in surface water and groundwater: American Chemical Society Symposium Series, v. 630, p. 200-225.
Blum, D.A., Carr, J.D., Davis, R.K., and Pederson, D.T., 1993, Atrazine in a stream-aquifer system: Transport of atrazine and its environmental impact near Ashland, Nebraska: Ground Water Monitoring and Remediation, v. 13, no. 2, p. 125133.
Browner, C.M., 1996, Pesticides and ground water State Management Plan regulation: Proposed rule: Federal Register, v. 61, no. 124, p. 33260-33301.
Burkart, M.J., and Kolpin, D.W., 1993, Hydrologic and land-use factors associated with herbicides and nitrate in near-surface aquifers: Journal of Environmental Quality, v. 22, no. 4, p. 646-656.
Capel, P.D., Lin, Ma, and Wotzka, P.J., 1998, Wet atmospheric deposition of pesticides in Minnesota, 1989-94: U.S. Geological Survey Water Resources Investigations Report 97-4026, 43 p.
Christenson, S.C, and Rea, Alan, 1993, Ground-water quality in the Oklahoma City urban area, chap. 24 in Alley, W.M., ed., Regional Ground-Water Quality: New York, Van Nostrand Reinhold, p. 589-611.
Demon, M., Schiavon, M., Portal, J.M., and Munier-Lamy, C., 1994, Seasonal dynamics of atrazine in three soils under outdoor conditions: Chemosphere, v. 28, no. 3, p. 453-466.
Domagalski, J.L., and Dubrovsky, N.M., 1991, Regional assessment of nonpoint-source pesticide residues in ground water, San Joaquin Valley, California: U.S. Geological Survey Water Resources Investigations Report 91-4027, 64 p.
Eichers, T.R., Andrilenas, P.A., Blake, H., Jenkins, R., and Fox, A., 1970, Quantities of pesticides used by farmers in 1966: U.S. Department of Agriculture, Economic Research Service, Agricultural Economic Report 179, 61 p.
Eichers, T.R., Andrilenas, P.A., Jenkins, R., and Fox, A., 1968, Quantities of pesticides used by farmers in 1964: U.S. Department of Agriculture, Economic Research Service, Agricultural Economic Report 131, 37 p.
---1978, Farmers use of pesticides in 1976: U.S. Department of Agriculture, Economics, Statistics, and Cooperatives Service, Agricultural Economic Report 418, 58 p.
Exner, M.E., and Spalding, R.F., 1990, Occurrence of pesticides and nitrate in Nebraskas ground water: Lincoln, Nebr., University of Nebraska, Institute of Agriculture and Natural Resources, Water Center, 34 p.
Fenneman, N.M., 1946, Physical divisions of the United States: U.S. Geological Survey, scale 1:7,000,000, 1 sheet. Field, J.A. and Thurman, E.M., 1996, Glutathione conjugation and contaminant transformation: Environmental Science and Technology, v. 30, no. 5, p. 1413-1418.
Gianessi, L.P., and Anderson, J.E., 1995, Pesticide use in U.S. crop production: National data report: Washington, D.C., National Center for Food and Agricultural Policy, unpaged [Revised April 1996].
Gianessi, L.P. and Puffer, C., 1990, Herbicide use in the United States: Washington, D.C., Resources for the Future, Quality of the Environment Division, 128 p. P> Gilliom, R.J., Alley, W.M., Gurtz, M.E., 1995, Design of the National Water-Quality Assessment Program: Occurrence and distribution of water-quality conditions: U.S. Geological Survey Circular No. 1112, 33 p. Gilliom, R.J., Mueller, D.K., and Nowell, L.H., 1998, Methods for comparing water-quality conditions among National Water-Quality Assessment study units, 19921995: U.S. Geological Survey Open-File Report 97-589, 54 p.
Goetsch, W.D., McKenna, D.P., and Bicki, T.J., 1992, Statewide survey for agricultural chemicals in rural, private water-supply wells in Illinois: Springfield, Ill., Illinois Department of Agriculture, Bureau of Environmental Programs, 4 p. P> Holden, L.R., Graham, J.A., Whitmore, R.W., Alexander, W.J., Pratt, R.W., Liddle, S.K., and Piper, L.L, 1992, Results of the National Alachlor Well Water Survey: Environmental Science and Technology, v. 26, no. 5, p. 935-943.
Jones, R.L., Hansen, J.L., Romine, R.R., and Marquardt, T.E., 1986, Unsaturated zone studies of the degradation and movement of aldicarb and aldoxycarb residues: Environmental Toxicology and Chemistry, v. 5, p. 361-372.
Jones, R.L., Hunt, T.W., Norris, F.A., and Harden, C.F., 1989, Field research studies on the movement and degradation of thiodicarb and its metabolite methomyl: Journal of Contaminant Hydrology, v. 4, p. 359-371.
Kauffman, D.D., and Kearney, P.C., 1970, Microbial degradation of the s-triazine herbicides: Reviews of Environmental Contamination and Toxicology, v. 32, p. 235-265.
Kim, Heekyung, and Hemond, H.F., 1998, Natural discharge of volatile organic compounds from contaminated aquifer [sic] to surface waters: Journal of Environmental Engineering, v. 124, no. 8, p. 744-751.
Klaseus, T.G., Buzicky, G.C., and Schneider, E.C., 1988, Pesticides and groundwater: Surveys of selected Minnesota wells: Minnesota Department of Health and Minnesota Department of Agriculture report prepared for the legislative commission on Minnesota Resources, 95 p. Kolpin, D.W., 1997, Agricultural chemicals in groundwater of the midwestern United States: Relations to land use: Journal of Environmental Quality, v. 26, no. 4, p. 1025-1037.
Kolpin, D.W., Barbash, J.E., and Gilliom, R.J., 1998a, Occurrence of pesticides in shallow ground water of the United States: Initial results from the National Water-Quality Assessment Program: Environmental Science and Technology, v. 32, no. 5, p. 558-566.
Kolpin, D.W., and Burkart, M.R., 1991, Work plan for regional reconnaissance for selected herbicides and nitrate in ground water of the mid-continental United States, 1991: U.S. Geological Survey Open-File Report 91-59, 18 p.
Kolpin, D.W., Burkart, M.R., and Thurman, E.M., 1993, Hydrogeologic, water-quality, and land-use data for the reconnaissance of herbicides and nitrate in near-surface aquifers of the midcontinental United States, 1991: U.S.Geological Survey Open-File Report 93-114, 61 p.
---1994, Herbicides and nitrate in near-surface aquifers in the midcontinental United States, 1991: U.S.Geological Survey Water-Supply Paper 2413, 34 p.
Kolpin, D.W., Goolsby, D.A., and Thurman, E.M., 1995, Pesticides in near-surface aquifers: An assessment using highly sensitive analytical methods and tritium: Journal of Environmental Quality, v. 24, no. 6, p. 1125-1132.
Kolpin, D.W., Kalkhoff, S.J., Goolsby, D.A., Sneck-Fahrer, D.A., and Thurman, E.M., 1997, Occurrence of selected herbicides and herbicide degradation products in Iowas ground water, 1995: Ground Water, v. 35, no. 4, p. 679-688.
Kolpin, D.W., Nations, B.K., Goolsby, D.A., and Thurman, E.M., 1996a, Acetochlor in the hydrologic system in the midwestern United States, 1994. Environmental Science and Technology, v. 30, no. 5, p. 1459-1464.
Kolpin, D.W., and Thurman, E.M., 1995, Postflood occurrence of selected agricultural chemicals and volatile organic compounds in near-surface unconsolidated aquifers in the Upper Mississippi River Basin, 1993, chap. G of Floods in the upper Mississippi River Basin, 1993: U.S.Geological Survey Circular 1120, 20 p.
Kolpin, D.W., Thurman, E.M. and Goolsby, D.A., 1996b, Occurrence of selected pesticides and their metabolites in near-surface aquifers of the midwestern United States: Environmental Science and Technology, v. 30, no. 1, p. 335-340.
Kolpin, D.W., Thurman, E.M., and Linhart, S.M., 1998b, The environmental occurrence of herbicides: The importance of degradates in ground water: Archives of Environmental Contamination and Toxicology, v. 35, no. 3, p. 385-390.
Kolpin, D.W., Zichelle, K.E., and Thurman, E.M., 1996c, Water-quality data for nutrients, pesticides, and volatile organic compounds in near-surface aquifers of the midcontinental United States, 1992-1994: U.S.Geological Survey Open-File Report 96-435, 47 p.
Komor, S.C., and Emerson, D.G., 1994, Movements of water, solutes, and stable isotopes in the unsaturated zones of two sand plains in the upper Midwest: Water Resources Research, v. 30, no. 2, p. 253-267.
Kross, B.C., Hallberg, G.R., Bruner, D.R., Libra, R.D., Rex, K.D., Weih, L.M.B., Vermace, M.E., Burmeister, L.F., Hall, N.H., Cherryholmes, K.L, Johnson, J.K., Selim, M.I., Nations, B.K., Seigley, L.S., Quade, D.J., Dudler, A.G., Sesker, K.D., Culp, M.A., Lynch, C.F., Nicholson, H.F., and Hughes, J.P., 1990, The Iowa state-wide rural well-water survey water quality data: Initial analysis. Iowa Department of Natural Resources Technical Information Series, no. 19, 142 p.
Land, L.F., 1996, Water-quality assessment of the Trinity River basin, Texas: Pesticides in urban and agricultural streams, 19931995: U.S. Geological Survey Fact Sheet FS 96-178, 2 p.
Larson, S.J., Capel, P.D., and Majewski, M.S., 1997, Pesticides in surface waters: Distribution, trends, and governing factors: Chelsea, Mich., Ann Arbor Press, Pesticides in the Hydrologic System series, v. 3, 390 p.
Loch, J.P.G., 1991, Effect of soil type on pesticide threat to the soil/groundwater environment, in Richardson, M.L., ed., Chemistry, agriculture and the environment: Cambridge, England, The Royal Society of Chemistry, p. 291-307.
Majewski, M.S. and Capel, P.D., 1995, Pesticides in the atmosphere: Distribution, trends, and governing factors: Chelsea, Mich., Ann Arbor Press, Pesticides in the Hydrologic System series, v. 1, 228 p.
Marinovich, M.F., Ghilardi, R.; Galli, C.L., 1996, Effect of pesticide mixtures on in vitro nervous cells: Comparison with single pesticides: Toxicology, v. 108, no. 3, p. 201-206.
McKenna, D.P., 1990, Geologic mapping for protection of groundwater resources, in Ertel, Madge, compiler, Information exchange on models and data needs relating to the impact of agricultural practices on water quality: Workshop proceedings: Reston, Va., U.S. Geological Survey, Office of Water Data Coordination, p. 99-100.
Meister Publishing Company, 1998, Farm chemicals handbook, 98: Willoughby, Ohio, Meister Publishing, variously paged.
Mills, M.S. and Thurman, E.M., 1994, Reduction of nonpoint source contamination of surface water and groundwater by starch encapsulation of herbicides: Environmental Science and Technology, v. 28, no. 1, p. 7379.
Nowell, L.H., and Resek, E.A., 1994, Summary of national standards and guidelines for pesticides in water, bed sediment, and aquatic organisms and their application to water-quality assessments: U.S. Geological Survey Open-File Report 94-44, 115 p.
Potter, T.L., and Carpenter, T.L., 1995, Occurrence of alachlor environmental degradation products in groundwater: Environmental Science and Technology, v. 29, no. 6, p. 1557-1563.
Reddy, K.N., Locke, M.A. and Zablotowicz, R.M., 1997, Soil type and tillage effects on sorption of cyanazine and degradation products: Weed Science, v. 45, p. 727-732.
Richards, R.P., Baker, D.B., Creamer, N.L., Kramer, J.W., Ewing, D.E., Merryfield, B.J., and Wallrabenstein, L.K., 1996, Well water quality, well vulnerability, and agricultural contamination in the midwestern United States: Journal of Environmental Quality, v. 25, no. 3, p. 389-402.
Roux, P.H., Balu, K., and Bennett, Rodney, 1991a, A large-scale retrospective ground water monitoring study for metolachlor: Ground Water Monitoring Review, v. 11, no. 3, p. 104-114.
Roux, P.H., Hall, R.L., and Ross, R.H., Jr., 1991b, Small-scale retrospective ground water monitoring study for simazine in different hydrogeological settings: Ground Water Monitoring Review, v. 11, no. 3, p. 173-181.
Rudolph, D., Goss, J., Graham, A., Kachanoski, G., Scafe, M., Aspinall, D., van den Broek, R., Clegg, S., Barry, D., and Stimson, J., 1992, Ontario farm groundwater quality survey winter 1991/92: University of Waterloo, Waterloo Centre for Groundwater Research, 152 p.
---1993, Ontario farm groundwater quality survey summer 1992: University of Waterloo, Waterloo Centre for Groundwater Research, 162 p.
Ryker, S.J., and Williamson, A.K., 1996, Pesticides in public supply wells of Washington State: U.S. Geological Survey Fact Sheet FS 96-122, 2 p.
Schiavon, M., 1988, Studies of the leaching of atrazine, of its chlorinated derivatives, and of hydroxyatrazine from soil using 14C ring-labeled compounds under outdoor conditions: Ecotoxicology and Environmental Safety, v. 15, p. 46-54.
Sievers, D.M., and Fulhage, C.D., 1992, Survey of rural wells in Missouri for pesticides and nitrate, Ground Water Monitoring Review, v. 12, no. 4, p. 142-150.
Squillace, P.J., Thurman, E.M., and Furlong, E.T., 1993, Groundwater as a nonpoint source of atrazine and deethylatrazine in a river during base flow conditions: Water Resources Research, v. 29, no. 6, p. 1719-1729.
Squillace, P.J., Zogorski, J.S., Wilber, W.G., and Price, C.V., 1996, Preliminary assessment of the occurrence and possible sources of MTBE in groundwater in the United States, 19931994: Environmental Science and Technology, v. 30, no. 5, p. 1721-1730.
Steichen, J., Koelliker, J., Grosh, D., Heiman, A., Yearout, R., and Robbins, V., 1988, Contamination of farmstead wells by pesticides, volatile organics, and inorganic chemicals in Kansas: Ground Water Monitoring Review, v. 8, no. 3, p. 153-159.
Tessier, D.M., and Clark, J.M., 1995, Quantitative assessment of the mutagenic potential of environmental degradative products of alachlor. Journal of Agricultural and Food Chemistry, v. 43, no. 9, p. 2504-2512.
Thompson, H.M., 1996, Interactions between pesticides: A review of reported effects and their implications for wildlife risk assessment: Ecotoxicology, v. 5, p. 59-81.
U.S. Department of Agriculture, 1995, Pesticide Properties Database: Agricultural Research Service (accessed March 11, 1988, on the World Wide Web at URL http://www.arsusda.govrsml/ppdb2.html; last update May, 1995).
U.S. Department of Commerce, 1995, 1992 census of agriculture Geographic area series 1B: U.S. Summary and County Level Data, 1992; U.S. Department of Commerce, Bureau of the Census: Data User Services Division.
U.S. Environmental Protection Agency, 1990, National survey of pesticides in drinking water wells: Phase I report: Environmental Protection Agency, Office of Pesticides and Toxic Substances, EPA 570/9-90-015, variously paged.
---1991, Pesticides And Ground-Water Strategy: U.S. Environmental Protection Agency, Office of Pesticides and Toxic Substances, Publication 21T-1022, 78 p.
---1992, Another lookNational survey of pesticides in drinking water wells: Phase II report: U.S. Environmental Protection Agency, Office of Pesticides and Toxic Substances, EPA/579/09-91/020 [available from National Technical Information Service, Springfield, Va., as NTIS Report PB 91-125765].
---1993, Guidance for pesticides and ground water state management plans: Implementation document for the pesticides and ground water strategy: U.S. Environmental Protection Agency, Office of Prevention, Pesticides, and Toxic Substances, EPA 735-B-93-005a, variously paged.
---1994, Pesticide Environmental Fate Database One-Line SummaryAcetochlor: U.S. Environmental Protection Agency data, last update September 9, 1994, available from the U.S. Environmental Protection Agency, Office of Pesticide Programs, Environmental Fate and Effects Division, Washington, D.C.
---1996, Drinking water regulations and health advisories: U.S. Environmental Protection Agency, Office of Water, EPA 822-R-96-001, 16 p.
U.S.Geological Survey, 1998, Pesticides in surface and ground water of the United States: Summary of results of the National Water-Quality Assessment Program (NAWQA): Pesticide National Synthesis Project, (accessed August 15, 1998, on the World Wide Web at URL http://ca.water.usgs.gov/pnsp/allsum/
Werner, S.L., Burkhardt, M.R. and DeRusseau, S.N., 1996, Methods of analysis by the U.S.Geological Survey National Water-Quality Laboratory: Determination of pesticides in water by Carbopak-B solid-phase extraction and high-performance liquid chromatography: U.S. Geological Survey Open-File Report No. 96-216, 42 p.
Whitmore, R.W., Kelly, J.E., and Reading, P.L., 1992, Executive summary, results, and recommendations, v. 1 of National Home and Garden Pesticide Use Survey: U.S. Environmental Protection Agency, EPA RTI/5100/17-01F68-WO-0032, 140 p.
Zaugg, S.D., Sandstrom, M.W., Smith, S.G., and Fehlberg, K.M., 1995, Methods of analysis by the U.S. Geological Survey National Water Quality Laboratory: Determination of pesticides in water by C-18 solid-phase extraction and capillary-column gas chromatography/mass spectrometry with selected-ion monitoring: U.S. Geological Survey Open-File Report No. 95-181, 49 p.

![]() U.S. Department of the Interior | U.S. Geological Survey
U.S. Department of the Interior | U.S. Geological Survey
URL: http://water.usgs.gov/nawqa/pnsp/pubs/wrir984245/text.html
Page Contact Information: gs-w_nawqa_whq@usgs.gov
Page Last Modified: Tuesday, 04-Mar-2014 14:44:42 EST

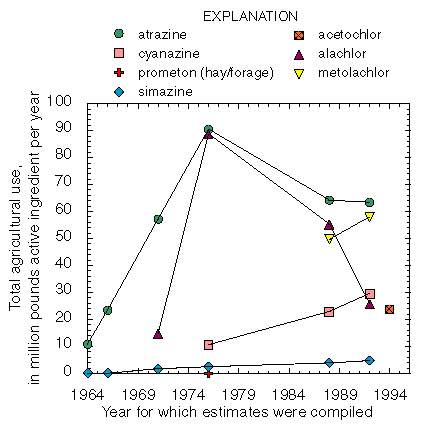
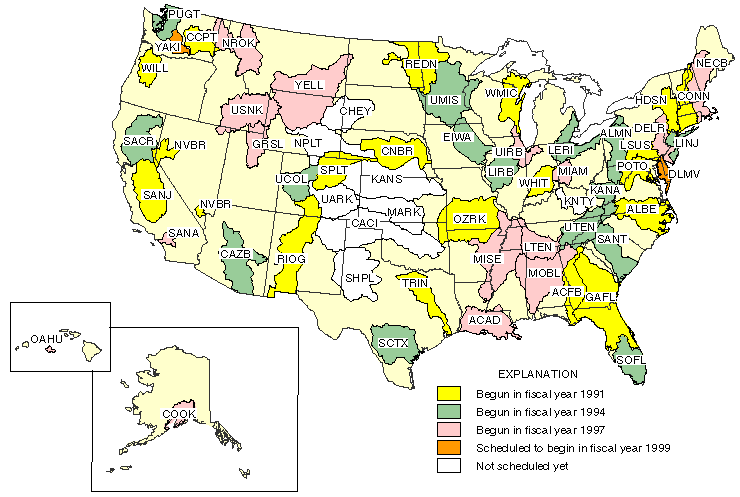
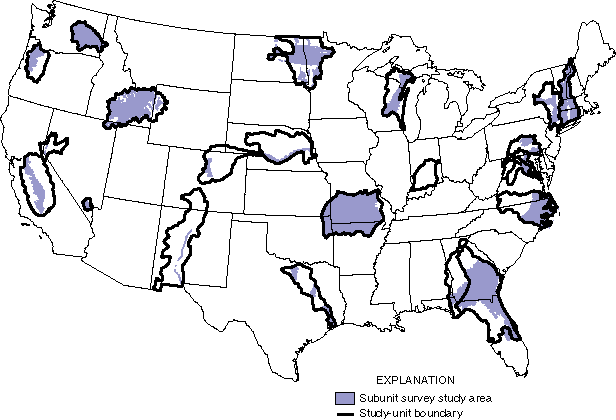
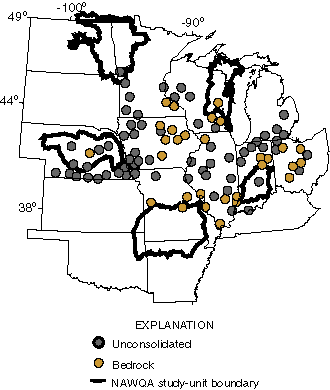
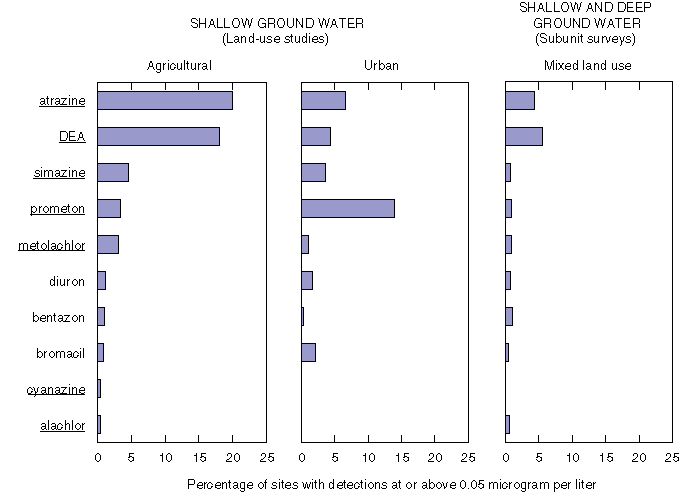
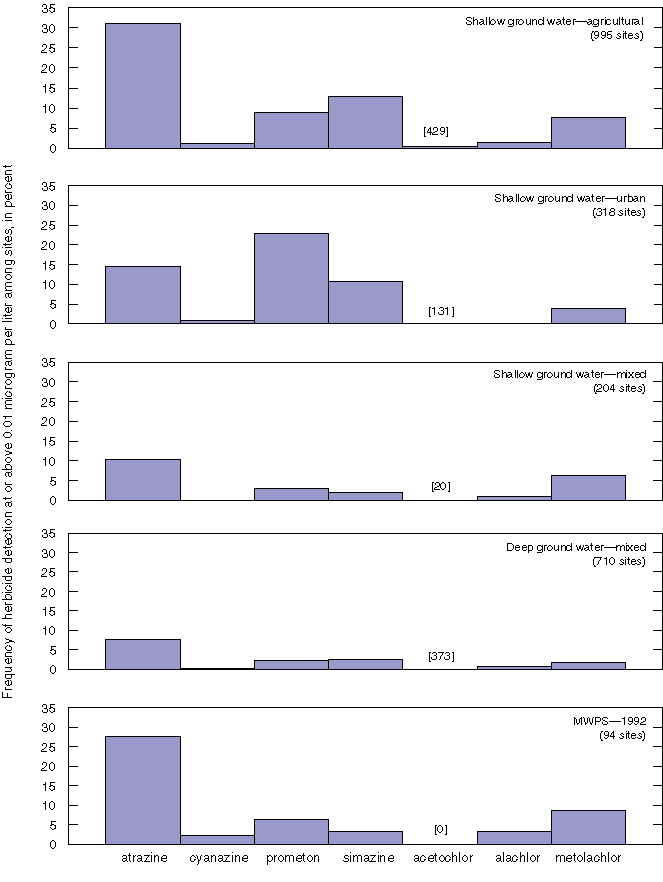
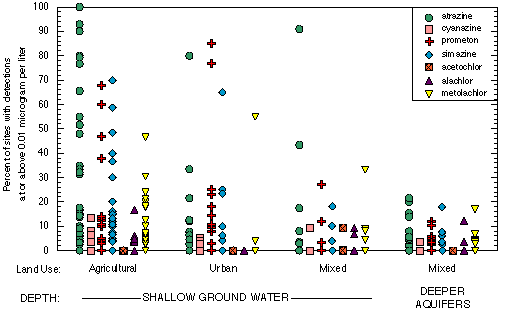
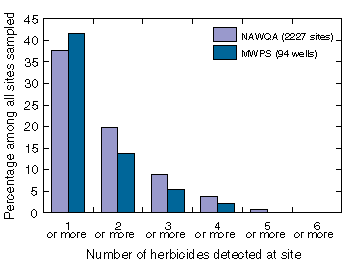
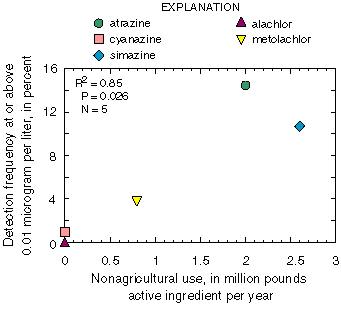
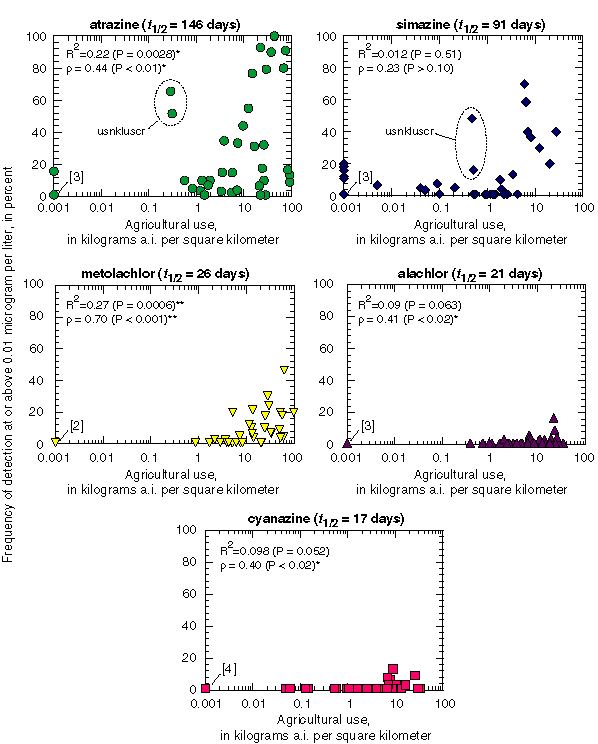
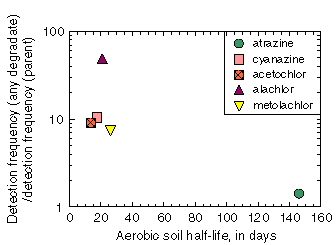
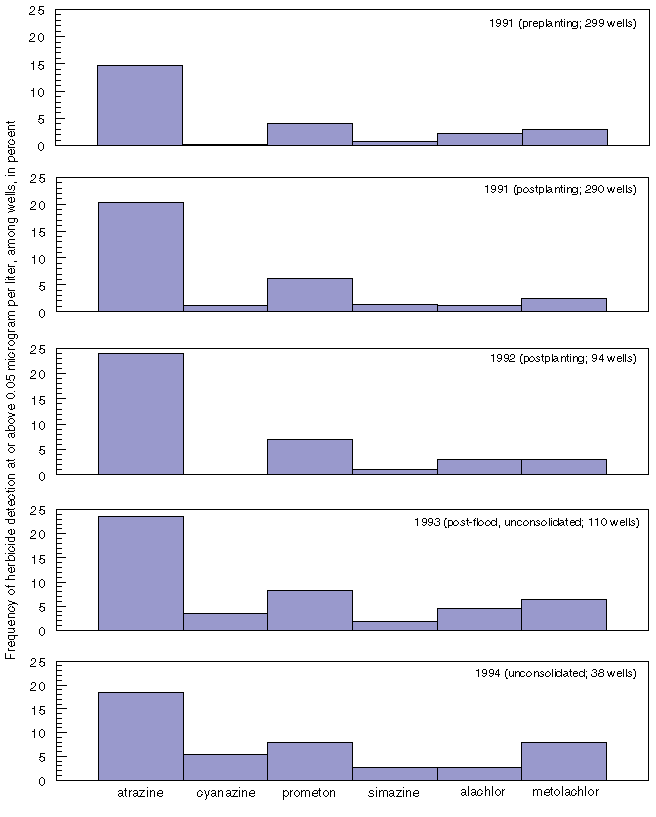
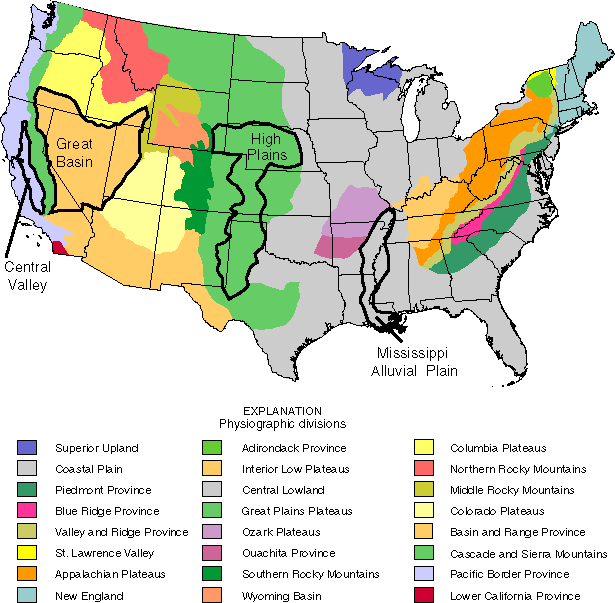
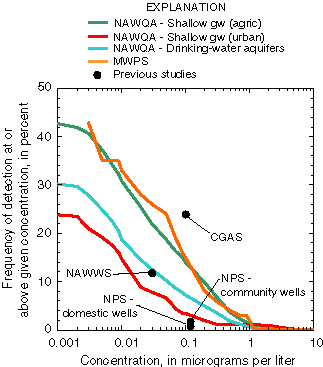
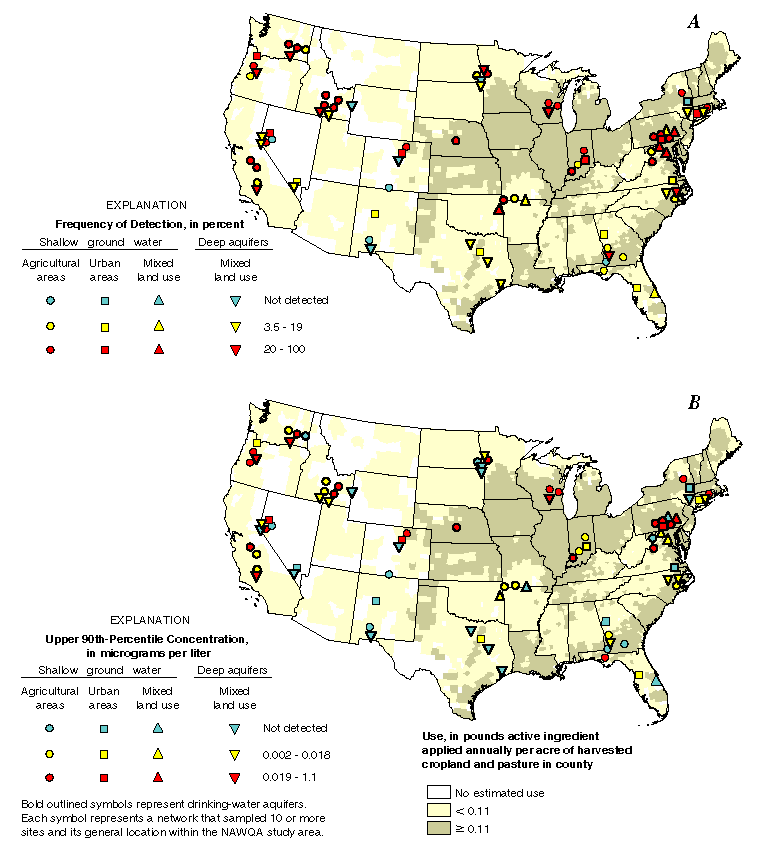
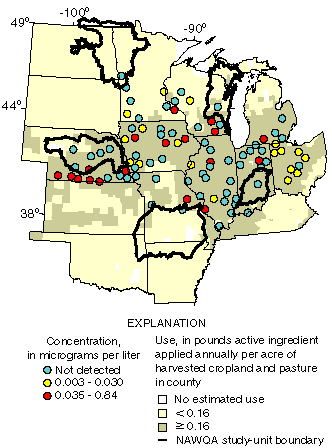
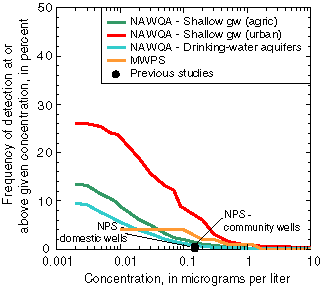
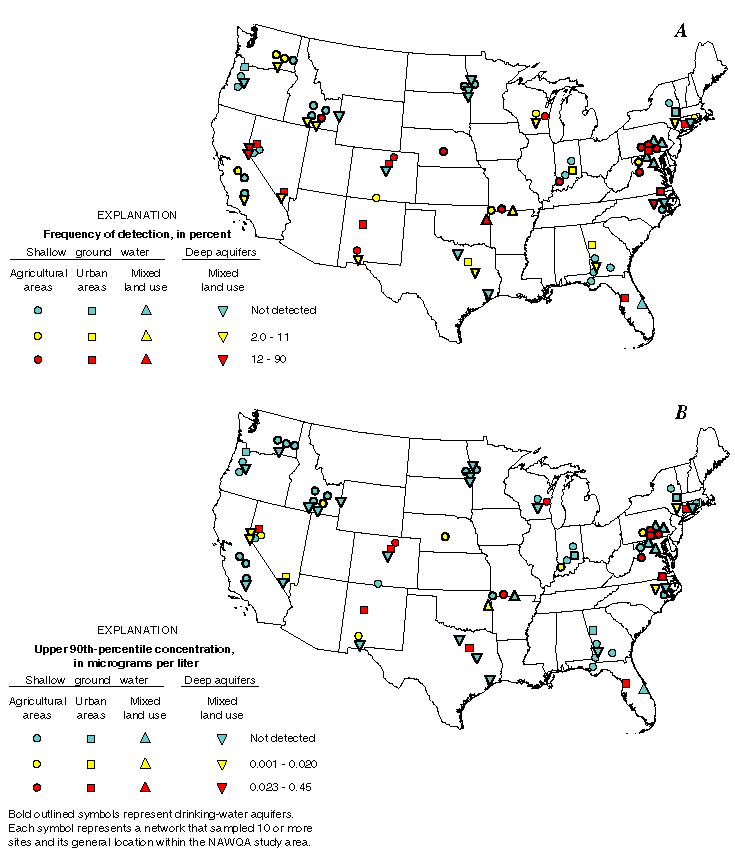
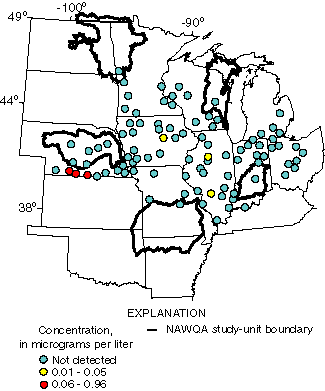
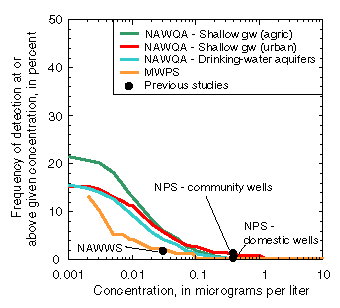
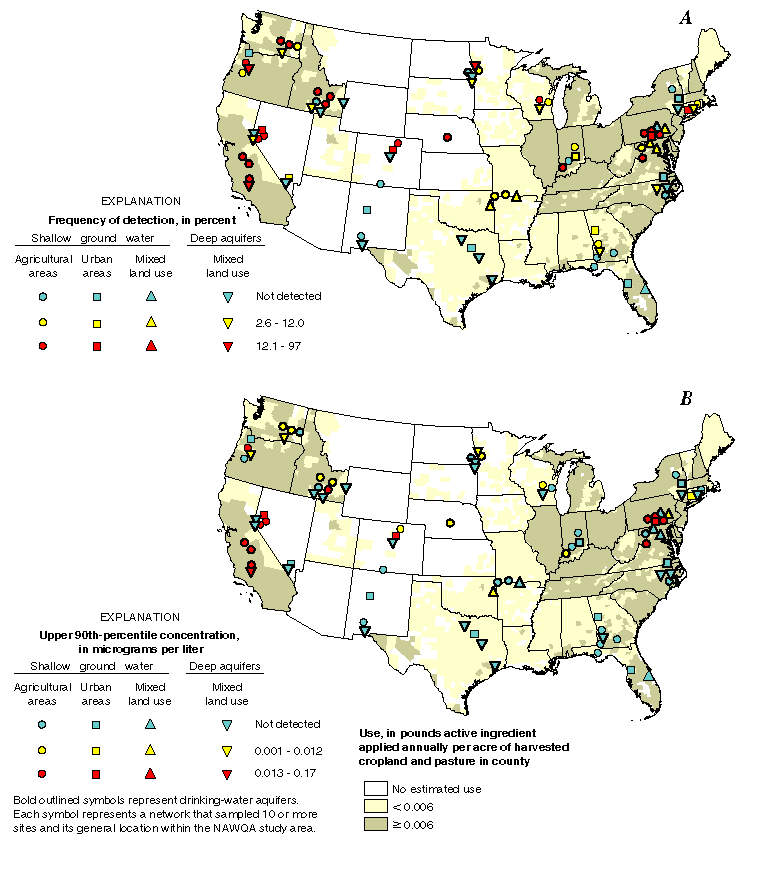
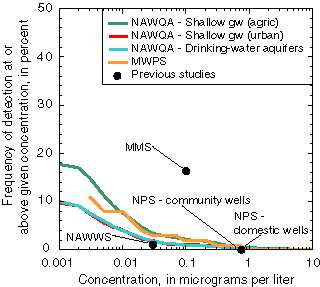
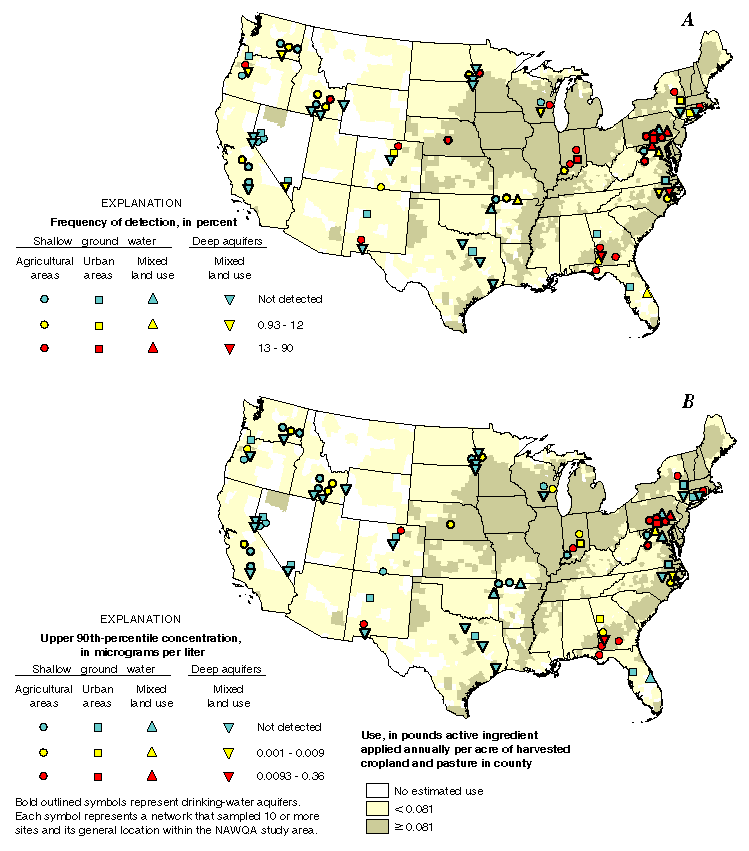
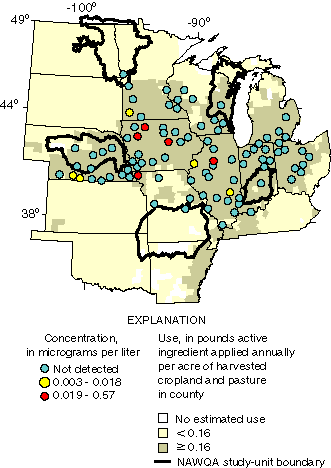
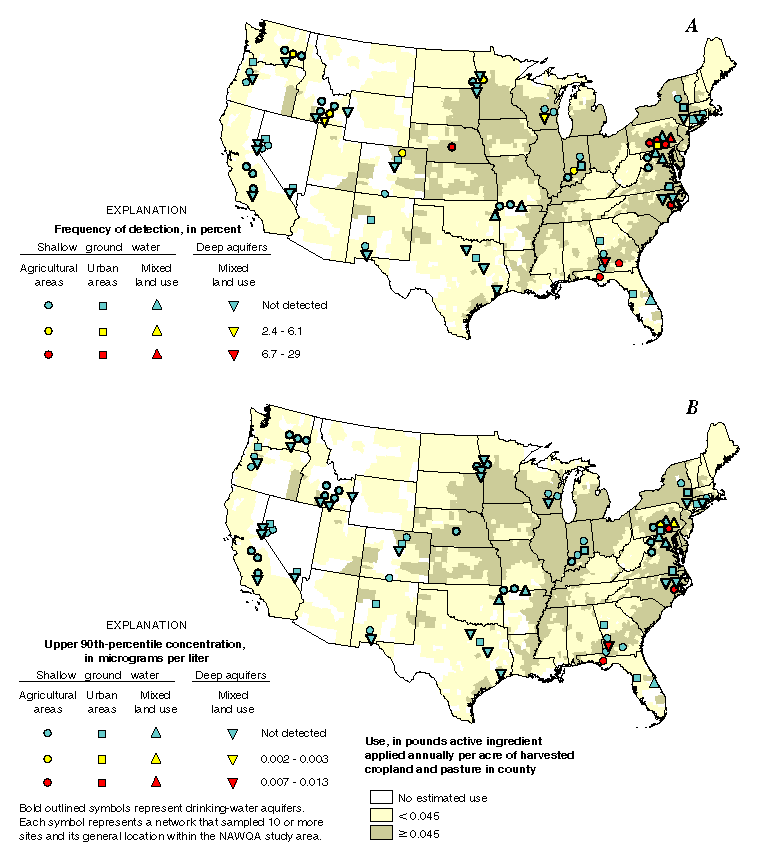
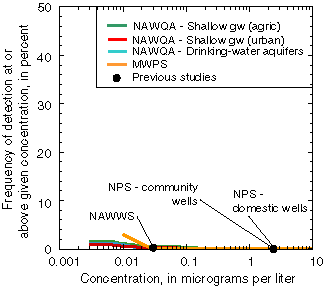
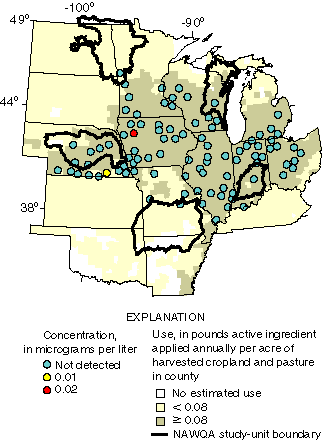
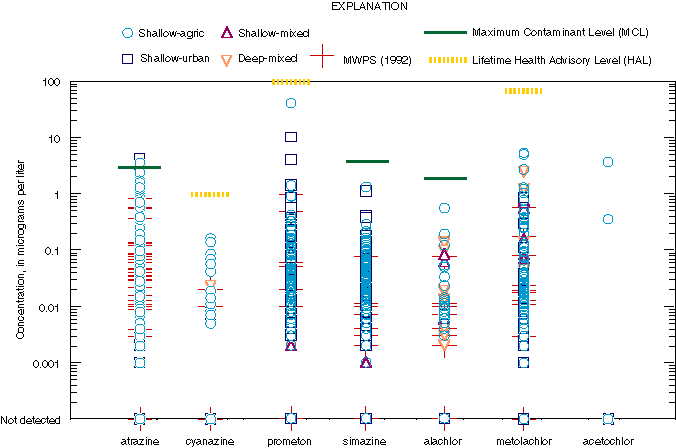