National Water-Quality Assessment (NAWQA) Project
Go to:
BACK TO CIRCULAR 1291 Materials Page
About 1 billion pounds of conventional pesticides are used each year in the United States to control weeds, insects, and other pests (http://www.epa.gov/oppbead1/pestsales/) . The use of pesticides has resulted in a range of benefits, including increased food production and reduction of insect-borne disease, but also raises questions about possible harm to the environment, including potential effects on drinking-water sources and aquatic life.
Pesticides are released into the environment primarily through their application to agricultural lands, including croplands, orchards, and pastures, and for nonagricultural pest control, such as on lawns and gardens, commercial areas, and rights-of-way. In 2001, agriculture accounted for about three-quarters of total national use, with the remaining quarter being applied for a wide range of non-agricultural purposes. The National Water-Quality Assessment (NAWQA) Program focused primarily on “nonpoint” sources of pesticides resulting from applications for pest management, although some sites downstream from major metropolitan areas also may be influenced by point sources, such as discharges from wastewater-treatment plants.
Information about selected pesticides can be accessed in EPA fact sheets http://www.epa.gov/pesticides/factsheets/index.htm . These fact sheets provide technical information on pesticides; for example, information about newly registered pesticides and re-registration eligibility decisions made on individual organophosphate pesticides, and information on biological pesticides. The National Pesticide Information Center, a cooperative effort of EPA and Oregon State University, also has many informative fact sheets on a myriad of individual pesticides (http://npic.orst.edu/npicfact.htm)
NAWQA measured the broadest range of pesticide compounds ever addressed in a national study. Even so, many pesticides in current use and most pesticide degradates were not measured. Most NAWQA water samples were analyzed for 75 pesticides and 8 degradates, including 20 of the 25 most heavily used herbicides and 16 of the 25 most heavily used insecticides, but few fungicides, fumigants, or other types of pesticides. In addition, 32 organochlorine pesticide compounds were analyzed in bed sediment and (or) fish tissue, including 19 parent pesticides and 13 degradates or manufacturing by-products. Most of the organochlorine pesticides are no longer used in the United States, but the parent compounds, degradates, or by-products still may persist in the environment. Although pesticide compounds analyzed by NAWQA represent many of the heavily used herbicides and insecticides, they only included a fraction of all pesticides currently in use, and few of their degradates. NAWQA findings can provide insights about what to expect for those pesticides not measured, but must be considered as only a partial assessment of currently used pesticides.
NAWQA assessments of pesticides were conducted in 51 major river basins and aquifer systems (referred to as “Study Units”) across the Nation, from Florida to the Pacific Northwest and including Hawaii and Alaska, plus the High Plains Regional Ground Water Study. Collectively, these areas account for more than 70 percent of total water use (excluding thermoelectric and hydropower), and more than 50 percent of the Nation’s supply of drinking water. The areas are representative of the Nation’s major hydrologic landscapes, and agricultural and urban sources of pesticides. (Go to the NAWQA web site for a map of study units.)
Each of the studies in the 51 major river basins and aquifers systems throughout the 10-year period of analysis followed a nationally consistent approach and used uniform methods of sampling and analysis. Water-quality conditions in a specific locality or watershed can be compared to those in other geographic regions and at different periods of time. Collectively, the assessments advance an understanding of the quality of our Nation’s waters and whether water quality is getting better or worse over time. Information at different scales helps to bridge local, State, regional, and national efforts to manage the Nation’s water resources.
The NAWQA assessment of pesticides provides the most comprehensive national-scale analysis to date of pesticide occurrence and concentrations in streams and ground water. Data are also collected by States, Tribes, utilities, localities, and other organizations but not at the national scale.
In general, no, because the NAWQA assessment was not designed to look at changes in pesticides (trends) that may have occurred during the period of study (1992-2001). Rather, the 10-year period reflects the total time for NAWQA to sample and assess pesticides in all 51 Study Units across the Nation. In order to effectively study the large areas, given the logistical and budget constraints, Study Units were assessed on a rotational schedule, with intensive data collection for the first 20 study units from 1992-1995, 16 study units from 1996-1998, and 15 study units and the High Plains study from 1999-2001. The combined results for the 1992-2001 study-period represent a composite picture of the decade. Most analyses of pesticides in stream water in the national compilation of data are based on one year of data for each site, generally representing the single most complete year of sampling, in order to give equal influence to each stream. Data analyses for ground water were based on one sample per well and data analyses for stream bed sediment and fish tissue were based on one sample per site.
NAWQA findings from the 1992-2001 national assessment provide a framework for trends and future assessment on whether pesticide levels in the Nation’s streams and ground water are increasing or decreasing over time. The major thrust for evaluating trends will, therefore, occur in the subsequent decade of NAWQA studies when selected streams and wells are systematically reassessed. However, an initial look at some changes that did emerge in the first ten-year assessment is noted below (see question related to changes).
NAWQA sampling sites are part of a “targeted” monitoring design that focuses on understanding the relations between water-quality conditions and the natural and human factors that cause those conditions. Monitoring sites are therefore not selected randomly within a grid, but because they represent certain human activities, environmental settings, or hydrologic conditions during different seasons or times of year. For example, sites may be selected to assess the effects of agriculture and urban development on pesticide and nutrient contamination in streams. Sampling locations for streams and ground water were selected or “targeted” to represent specific agricultural, urban, undeveloped, and mixed land-use settings of greatest significance to water resources in the primary hydrologic settings within each of the 51 Study Units. Sites were selected by local Study Unit teams in collaboration with local organizations, States, and Tribes, as well as NAWQA national teams. Streams and ground water were sampled most intensively in agricultural and urban areas because of the importance of assessing pesticide occurrence in areas where the compounds are used most intensively. This NAWQA approach focuses on achieving an understanding of the relations between water-quality conditions—such as related to pesticide occurrence—and the natural and human factors that cause those conditions. The assessment did not focus on specific sites with known water-quality problems or narrowly defined “issues of the day,” but rather on the condition of the total resource.
NAWQA uses a “targeted” monitoring design in which sites are not selected randomly within a grid, but because the represent certain human activities, land uses, environmental settings, or hydrologic conditions during different seasons or times of year (see question above). Such monitoring is useful to answer questions related to water-quality conditions and the natural and human factors that cause those conditions. Probabilistic monitoring involves random selection of sites across a certain geographic area. Such monitoring is useful for getting an unbiased, broad geographic snapshot of “whether or not there is a problem” and “how big the problem is.” Many probabilistic monitoring programs implemented by the States and the U.S. Environmental Protection Agency (EPA) provide quantitative, statistically valid estimates of, for example, the number of impaired stream miles with a region or State (http://www.epa.gov/emap/) . Probabilistic monitoring and more “targeted” monitoring (such as by NAWQA) answer different types of questions and provide different types of information that are both critical for understanding the ambient resource. Ideally, data-collection and laboratory analytical methods should be consistent and comparable between the two methods so that findings can be integrated and conclusions can go beyond what each can provide individually.
“Agricultural” streams drain watersheds that contain greater than 50 percent agricultural land and less than 5 percent urban land. The agricultural streams sampled are diverse in climate, geography, and crop types, and span coastal, desert, and temperate environmental settings. Agricultural settings included, for example, areas dominated by production of corn in the Midwest; wheat in the Great Plains; poultry in the east; pineapple in Hawaii; and vegetables in California. “Urban” streams drain watersheds that contain greater than 25 percent urban land and less than 25 percent agricultural land. The urban settings studied were primarily residential, typically with low-to-medium population densities (300 to 5,600 people per square mile).
None of the USGS stream sampling sites were located at drinking-water intakes. NAWQA assessments characterized the quality of untreated, ambient water resources in the Nation’s streams and ground water, and not the quality of finished, treated drinking water (as would be done by monitoring water from water-treatment plants or from household taps). By focusing on the quality of streams and ground water in their present conditions (ambient water quality), NAWQA complements many Federal, State, and local drinking-water monitoring programs.
Water samples for pesticide analysis were collected from 186 streams within the 51 Study Units, bed-sediment samples were collected from 1,052 stream sites, and fish samples were collected from 700 stream sites. Ground-water samples were collected from 5,047 wells in 187 ground-water study areas (each study generally included 20 to 30 wells). Shallow ground water (generally less than 20 feet below the water table) was sampled in agricultural, urban, and undeveloped areas, mostly from new or existing observation wells or domestic supply wells. Deeper ground water was sampled from wells that tap major aquifers, which was almost exclusively from existing wells used either for domestic or public supply. Fewer stream sites were sampled for water because the study of each site requires numerous water samples over time, whereas bed-sediment, fish, and ground water studies were based on one sample per site.
Water samples were collected from streams throughout the year, including high-flow and low-flow conditions. Sampling was most intensive during the time of highest pesticide use and runoff—generally weekly or twice monthly for a 4- to 9-month period. During the active study periods in each Study Unit, most sites were sampled 20 to 40 times a year, with the most intense sampling during the seasonal periods of highest pesticide use. Data analyses for ground water was based on one sample per well. Repeated sampling, such as that conducted at stream sites, was not included for ground water because of the comparatively slow rate of change in most ground-water systems, relative to streams.
Local, State, Tribal, and national stakeholders use NAWQA information to design and implement strategies for managing, protecting, and monitoring water resources in many different hydrologic and land-use settings across the Nation (http://water.usgs.gov/nawqa/xrel.pdf). For example, the Alabama Department of Agriculture and Industries states that “the NAWQA Program has filled a tremendous void in the pesticide data that the State of Alabama must acquire in the development of the EPA-mandated State Pesticide Management Plan. The NAWQA data are used to make important determinations and the plan can target the areas of greatest importance.”
USGS has worked closely with the U.S. Environmental Protection Agency (EPA) during the 10-year study. EPA uses the data extensively in their exposure and risk assessments for regulating the use of pesticides. (Learn more about how EPA regulates certain chemicals or types of pesticides at http://www.epa.gov/pesticides/factsheets/reg_fs.htm). For example, EPA used USGS data in its risk assessments for the reevaluation of diazinon, chlorpyrifos, cyanazine and alachlor. Uses of three of these pesticides (diazinon, chlorpyrifos and cyanazine) have now been significantly limited, and usage of alachlor was voluntarily reduced and largely replaced by a registered alternative. The USGS findings show strong relations between the occurrence of pesticides and their use, and point out that some of the frequently detected pesticides, including the insecticide diazinon and the herbicides alachlor and cyanazine, are declining. As new pesticides are approved for use, EPA will continue to need monitoring data to ensure that levels in the environment are safe.
EPA and USGS have also collaborated in developing statistical models to predict concentrations of atrazine and other pesticides in streams across the country. The models increase EPA’s capability to identify areas predicted to have significant impacts on water quality from pesticide use, especially where monitoring data are not available. The model results also are used to identify locations where additional monitoring is most needed to evaluate the ecological condition of watersheds.
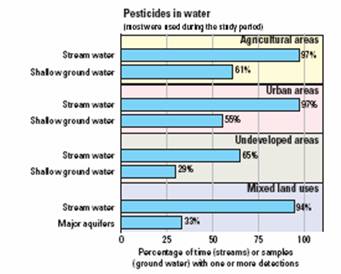
The simple answer is “yes”—pesticides are frequently present. However, this answer needs to be broken down by streams versus ground water, which have quite different levels of occurrence; and by currently used pesticides versus pesticides that are no longer used.
In stream water, one or more pesticide compounds were almost always present at detectable levels (represented below by the upper bar in each land-use category). There were detectable concentrations in water more than 90 percent of the time across all streams sampled that had significant agricultural or urban land use in their watersheds. Undeveloped streams had detectable pesticides more than half the time. Most of the pesticides measured in water were in use during the study period. Ground water had less frequent detections in well samples compared to streams, but pesticides nevertheless were found in more than half the wells tapping shallow ground water in agricultural and urban areas (represented by the lower bar in each land-use category). There were detections in one third of the existing production wells sampled in major aquifers.
About 40 pesticide compounds, of the more than 100 examined by NAWQA, accounted for most detections in water, fish, and sediment. Twenty five pesticide compounds, including 24 pesticides and 1 degradate, were each detected in more than 10 percent of water samples from streams in agricultural, urban, or mixed land-use settings, or in more than 2 percent of wells in agricultural or urban settings. Additional information about selected pesticides can be accessed in EPA fact sheets http://www.epa.gov/pesticides/factsheets/index.htm . These fact sheets provide technical information on pesticides; for example, information about newly registered pesticides and re-registration eligibility decisions made on individual organophosphate pesticides, and information on biological pesticides. The National Pesticide Information Center, a cooperative effort of EPA and Oregon State University, also has many informative fact sheets on a myriad of individual pesticides (http://npic.orst.edu/npicfact.htm)
The pesticide compounds detected most frequently in streams and ground water were mainly those with the most extensive use in agricultural and urban areas —either during the study period or historically—and those with the greatest mobility and (or) persistence in the hydrologic system.
The specific pesticides most frequently detected in water included herbicides used most heavily in agriculture, herbicides with major nonagricultural uses, and several insecticides. Three herbicides mainly used for agricultural purposes—atrazine, metolachlor, and cyanazine—were among the most frequently detected in agricultural streams and were more frequently detected in agricultural streams than in urban streams. In contrast, three herbicides commonly used in urban areas—simazine, prometon, and tebuthiuron—were detected more often in urban streams than in agricultural streams. Finally, insecticides were found much more frequently in urban streams than in most agricultural streams, with diazinon, chlorpyrifos and carbaryl most frequently detected. The same relative patterns were observed in ground water, but at much lower frequencies of detection. Overall, results for each individual pesticide reveal a unique pattern of distribution resulting from its primary uses, the distributions of land uses and crops, and the chemical and physical properties of the pesticide.
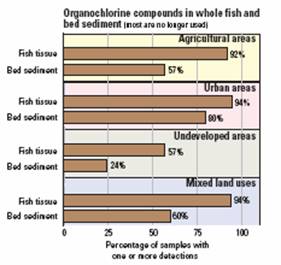
In streams, organochlorine compounds, such as DDT and their degradates and by-products were found in fish and bed-sediment samples from most streams in agricultural, urban, and mixed-land-use watersheds and in more than half the fish from streams with predominantly undeveloped watersheds. Most of the organochlorine pesticides have not been used in the United States since before the NAWQA studies began, but their continued presence demonstrates their persistence in the environment. More than 90 percent of fish-tissue samples from streams with developed watersheds had one or more detectable compounds and most sites had detections in bed sediment as well.
Thirteen organochlorine pesticide compounds, including historically used parent pesticides and their degradates and by-products, were each found in more than 10 percent of fish or bed-sediment samples from streams draining watersheds with either agricultural, urban, or mixed land use. In fish tissue, as well as bed sediment, the most frequently detected organochlorine compounds were those related to DDT, chlordane, and dieldrin. All uses of DDT were cancelled in 1972 and all uses of chlordane and dieldrin were cancelled by 1988.
No, pesticides occur in all land-use settings and occur where they are used. In fact, one of the major findings in the NAWQA study is the strong correlation between pesticide occurrence and land use and use intensity. The most intensive pesticide applications are in agricultural and urban areas, including substantial use for home, lawn, and garden pest control in residential areas.
The pesticides and degradates detected most frequently in streams and ground water in agricultural and urban areas were mainly those with the most extensive use—either during the study period or historically. Five herbicides commonly used in urban areas—simazine, prometon, tebuthiuron, 2,4-D, and diuron—and three commonly used insecticides—diazinon, chlorpyrifos, and carbaryl—were most frequently detected in the urban streams sampled, often at higher concentrations than in agricultural streams. The most frequently detected herbicides that are used mainly for agriculture—atrazine, metolachlor, cyanazine, alachlor, and acetochlor—generally were detected most often and at the highest concentrations in water samples from streams in agricultural areas with their greatest use, particularly in the Corn Belt.
Pesticide use is a major determining factor in pesticide occurrence, particularly in streams. For example, concentrations of atrazine, metolachlor, simazine, acetochlor, 2,4-D, chlorpyrifos, and diazinon in stream samples directly correlate with where they are used on crops. Some of the highest concentrations of atrazine were observed in streams within the Corn Belt and other areas where corn is a primary crop and where the herbicide is most heavily used. The NAWQA study clearly indicates that as pesticide use changes, such as in response to such factors as regulations and market forces, levels of pesticides in water samples change. Findings therefore must be evaluated in context of chemical use, during and after the study. For example, levels of the herbicide alachlor declined in streams in the Corn Belt (generally including Illinois, Indiana, Iowa, Nebraska, and Ohio, as well as parts of adjoining States) throughout the study period as its use on corn and soybeans declined, with no levels greater than its aquatic-life benchmark by the end of the study. In contrast, both the use and the levels of atrazine, the most heavily used herbicide in the Corn Belt region, remained relatively high throughout the study period.
The U.S. Environmental Protection Agency (EPA), which has worked closely with the USGS during the 10-year study, uses the data extensively in their exposure and risk assessments for regulating the use of pesticides (Learn more about how EPA regulates certain chemicals or types of pesticides at http://www.epa.gov/pesticides/factsheets/reg_fs.htm ). For example, EPA used USGS data in its risk assessments for the reevaluation of diazinon, chlorpyrifos, cyanazine and alachlor. Uses of three of these pesticides (diazinon, chlorpyrifos and cyanazine) have now been significantly limited, and usage of alachlor was voluntarily reduced and largely replaced by a registered alternative. The USGS findings show strong relations between the occurrence of pesticides and their use, and point out that some of the frequently detected pesticides, including the insecticide diazinon and the herbicides alachlor and cyanazine, are declining. As new pesticides are approved for use, EPA will continue to need monitoring data to ensure that levels in the environment are safe.
The strong correlations of pesticides found with the amounts and characteristics of pesticides used can help managers to anticipate and prioritize the pesticides most likely to affect water quality in different land-use settings. For those pesticides that are still being applied, reducing their use is likely to be the most effective way to reduce their concentrations in the hydrologic system, particularly for streams. For organochlorine pesticide compounds derived from past use, farm management practices that control the erosion of soil are likely to help reduce their transport to streams.
Unfortunately, current chemical-use information is generally insufficient—and in urban areas essentially unavailable—for local and regional water-resource management and decision making. Improved tracking of chemical use is needed to definitely attribute specific pollutants to different sources in nonpoint runoff and support management actions.
Three factors complicate the occurrence of pesticides in streams and ground water, including strong seasonal patterns, the prevalence of mixtures of pesticides, and the frequent occurrence of degradates. (see the next 3 questions below)
Pesticides almost always occur as complex mixtures of multiple compounds, rather than individually, whether in water, bed sediment, or fish tissue. Throughout most of the year (more than 90 percent of the time), water samples from streams with agricultural, urban, or mixed-land-use watersheds contained 2 or more pesticides or degradates, and about 20 percent of the time they had 10 or more. Mixtures were less common in ground water. Nevertheless, about half of the shallow wells in agricultural areas and about a third of the shallow wells in urban areas contained 2 or more pesticides and degradates—less than 1 percent had 10 or more. The co-occurrence of pesticides included thousands of unique mixtures, some uncommon and some very common. The herbicides atrazine (and its degradate, deethylatrazine), simazine, metolachlor, and prometon were common in mixtures found in streams and ground water in agricultural areas. The insecticides diazinon, chlorpyrifos, carbaryl, and malathion were common in mixtures found in urban streams. Studies of mixtures are still in the early stages, and it may take years for researchers to attain major advances in understanding their occurrence and potential for effects. The common occurrence of pesticide mixtures, particularly in streams, however, suggest that the study of mixtures should be a high priority.
Degradates are compounds formed by transformation of a pesticide by chemical, photochemical, or biological reactions. Factors that govern the formation and distribution of degradates in the hydrologic system include the use and persistence of parent pesticides, the persistence and mobility of the degradates, and the physical, chemical, and biological conditions in the environment. In many cases, transformation results in the conversion of the parent compound to a compound that is less toxic, but some degradates have similar or greater toxicities than their parent pesticide. Degradates were often as common in streams and ground water as their parent pesticides. For example, DDT, which was first used more than 50 years ago and discontinued about 30 years ago, was detected in fish from about 30 percent of agricultural streams, whereas DDE, a more stable degradate of DDT, was detected in fish from 90 percent of sampled agricultural streams. Atrazine, the most heavily used herbicide in the Nation during the study period, was found together with one of its several degradates, deethylatrazine, in about 75 percent of stream samples and about 40 percent of ground-water samples collected in agricultural areas across the Nation. Enhanced assessments of the occurrence and behavior of degradates in the hydrologic environment are needed, which would supplement the toxicity testing of major degradates now required by EPA as part of its risk assessments for pesticide registration. The enhanced assessments could include improved coverage of degradates in water-quality monitoring, continued research on pesticide transformations and transport in the hydrologic environment, and more comprehensive inclusion of degradates in toxicity studies.
Pesticide concentrations in stream water vary by season, with lengthy periods of low concentrations punctuated by seasonal pulses of much higher concentrations. For example, in streams that drain farmland throughout most of the Corn Belt, concentrations of herbicides were generally highest during spring runoff following pesticide applications. Effective management of streams may thereby require increased monitoring—including high-frequency sampling during seasons when intense pesticide use coincides with periods of high runoff—so that the periods with the highest pesticide concentrations are adequately characterized.
No. The presence of ‘detectable’ pesticides does not necessarily translate into adverse effects on humans or aquatic ecosystems because detections were often at low concentrations. USGS analytical methods are designed to measure low levels—sometimes parts per trillion—that are well below water-quality benchmarks for most pesticides. By this approach, the assessment helps to identify emerging issues and to track changes in concentrations over time, and it provides a comprehensive screen on the types of pesticides we can expect to see in different settings and areas of the country.
No. The USGS report is NOT a risk assessment study and findings should not be confused with risk assessments for specific pesticides by EPA. However, to place findings in a context for understanding potential effects on human health and aquatic life, measured concentrations by NAWQA were compared to screening level, water-quality benchmarks derived from standards and guidelines established by EPA, toxicity values from EPA pesticide risk assessments, and selected guidelines from other sources. The water-quality benchmarks are estimates of the concentrations below which adverse effects on humans, aquatic life, or fish-eating wildlife are not expected to occur. The screening-level assessment is primarily intended to identify and prioritize needs for further investigation (see next question).
To help place pesticide-occurrence data in a human-health or environmental context, NAWQA assessed potential effects based on comparing measured concentrations to water-quality benchmarks, which are estimates of the concentrations above which pesticides may have adverse effects on humans, aquatic life, or fish-eating wildlife. This “screening-level” assessment provides an initial perspective on the relevance of pesticide concentrations to human and environmental health, and is intended to identify and prioritize sites and pesticides that may require further investigation. Benchmarks are only indicators and should not be confused with detailed risk and toxicity assessments that are conducted by EPA in determining the safety of pesticides.
Most of the benchmarks used in the NAWQA screening-level assessment were derived from standards and guidelines established by EPA, toxicity values from EPA pesticide risk assessments, and selected guidelines from other sources. Most of the water-quality benchmarks are estimates of no-effect levels, such that concentrations below the benchmarks are expected to have a low likelihood of adverse effects. The presence of pesticides in streams or ground water at concentrations that exceed benchmarks does not indicate that adverse effects are certain to occur. Conversely, concentrations that are below benchmarks do not guarantee that adverse effects will not occur, but indicate that they are expected to be negligible.
There are several complexities and limitations. The potential for effects on humans, aquatic life, or wildlife may either be under or over estimated by benchmark comparisons in specific situations—the screening-level results are primarily intended to identify and prioritize needs for further investigation.
One or more EPA drinking-water standards or guidelines were available for 47 of the 83 pesticides and degradates analyzed by NAWQA. A total of 62 of the pesticide compounds analyzed by NAWQA in water have one or more aquatic-life benchmarks.
None of the USGS stream sampling sites were located at drinking-water intakes. However, for perspective, NAWQA measurements were compared to human-health benchmarks derived from U.S. Environmental Protection (EPA) agency drinking-water standards and guidelines, indicating that concentrations of individual pesticides were almost always lower than the human-health benchmarks. Less than 2 percent of streams draining undeveloped or mixed land-use watersheds and less than 10 percent of agricultural and urban streams had concentrations greater than these human-health benchmarks. Pesticides were less common in ground water than streams; less than 1 percent of domestic wells and public-supply wells used for drinking water exceeded EPA drinking-water standards and guidelines. Most exceedences were by dieldrin, which is no longer used.
EPA has developed “health and safety fact sheets” that include information such as safety precautions in applying pesticides to control mosquitoes, product recalls and EPA's process for protecting the public from pesticide residues in food, including the special efforts taken to protect infants and children http://www.epa.gov/pesticides/factsheets/health_fs.htm If you don't find an answer to your question about a chemical, you can try the National Pesticide Information Center (NPIC), which is a cooperative effort of EPA and Oregon State University. NPIC provides science-based information about a variety of pesticide-related subjects, including pesticide products, recognition and management of pesticide poisonings, toxicology, and environmental chemistry (http://npic.orst.edu/ ). NPIC also lists state pesticide regulatory agencies, and provides links to their Web site. NPIC can be contacted at: 1-800-858-7378 or by email at npic@ace.orst.edu. In addition, NPIC has produced many informative fact sheets (http://npic.orst.edu/npicfact.htm).
EPA has developed “Regulatory Action Fact Sheets” on how EPA regulates certain chemicals or types of pesticides (http://www.epa.gov/pesticides/factsheets/reg_fs.htm ).
The EPA, together with States, Tribes, and its many partners, protects public health by ensuring safe drinking water and protecting ground water. The agency oversees implementation of the Safe Drinking Water Act, which is the national law safeguarding drinking water provided by public water systems in America. Search the EPA website for safe water and learn about drinking water and ground water programs authorized under the Safe Drinking Water Act, such as how to find information about water quality; how to test your water quality; more information on drinking-water standards; how to find information about specific contaminants and pubic water systems; and more ( http://www.epa.gov/safewater/).
Most government agencies do not require routine monitoring of water quality for domestic wells. Although regulations vary within and among States, the quality of water from privately owned domestic wells generally is the homeowner’s responsibility. Routine monitoring is not required; however, most States and some local agencies provide guidance to domestic well owners through Web sites and printed materials. (http://www.epa.gov/safewater/privatewells/whereyoulive_state.html)
Exceedences in urban areas primarily relate to the more frequent presence of insecticides, which can be more toxic to aquatic life than herbicides. The pesticides with the greatest potential to affect urban streams during the study period were diazinon, chlorpyrifos, and malathion. The use of diazinon declined since the end of the 1992-2001 study period. Nonagricultural uses of chlorpyrifos have also been declining because of use restrictions (and the use of other pesticides may be changing as well). The reductions in use of some of the pesticides with the greatest potential for adverse effects (based on the USGS screening-level assessment) indicates that recent EPA restrictions on uses of diazinon and chlorpyrifos have the potential to reduce possible effects on aquatic life in urban streams if their uses are replaced with pesticides that reach streams in less toxic amounts or alternative approaches to pest control.
Concentrations of pesticides seldom occurred at levels thought to be toxic to fish (but rather toxicity applies mostly to aquatic plants and invertebrates). Less than 10 percent of urban and agricultural streams had levels of a pesticide that exceeded a benchmark for fish
USGS does not regulate or issue fish-consumption advisories. People are advised to contact their local, State, and Tribal departments of health, environmental control, ecology, or fish and game for updated information on fish consumption advisories.
Pesticides may have substantially greater effects on aquatic ecosystems than on humans based on comparisons of USGS findings to water-quality benchmarks for aquatic life and fish-eating wildlife. More than 80 percent of urban streams and more than 50 percent of agricultural streams had concentrations in water of at least one pesticide—mostly those in use during the study period—that exceeded a water-quality benchmark for aquatic life.
Urban streams had the highest proportion of benchmark exceedances in water (more than 80 percent of sites)—mostly by the insecticides diazinon, chlorpyrifos, and malathion—although frequencies of exceedance declined during the study period. Specifically, concentrations exceeded benchmarks in 95 percent of urban streams sampled during 1993-97 and in 64 percent of streams during 1998-2000. Most urban uses of diazinon and chlorpyrifos have been phased out since 2001 because of use restrictions impose by EPA. More than 50 percent of the agricultural streams had concentrations that exceeded one or more benchmarks. In the agricultural streams, the pesticides chlorpyrifos, azinphos-methyl, p,p'-DDE, and alachlor were among those most often found at concentrations that may affect aquatic life, with each being most important in areas where its use on crops is or was greatest. As the use of alachlor declined through the study period, its benchmark exceedences also declined, with none during the last 3 years of study.
Organochlorine pesticide compounds—mostly from pesticides that were no longer in use when the study began (such as DDT)— still persist in the environment and frequently exceeded aquatic-life benchmarks for concentrations in bed sediment, and wildlife benchmarks for concentrations in fish tissue, at stream sites in urban and agricultural areas. Comparisons of concentrations of organochlorine compounds in fish tissue with wildlife benchmarks indicate a wide range of potential for effects on fish-eating wildlife. The ranges of percentages shown on the graph reflect the uncertainties in benchmarks for fish-eating wildlife due to the lack of consensus on national-scale benchmarks or toxicity values. Pesticide compounds most commonly found in fish and stream sediment were primarily related to three organochlorine pesticides—DDT, dieldrin (plus aldrin), and chlordane. These compounds most frequently exceeded water-quality benchmarks for aquatic life and fish-eating wildlife in urban streams and in agricultural streams in areas where historical use on crops was greatest. For example, total DDT was measured at some of the highest concentrations in bed sediment and fish in parts of the Southeast and in parts of California, Oregon, and Washington, where DDT was historically used on cotton, tobacco, orchards, or other crops.

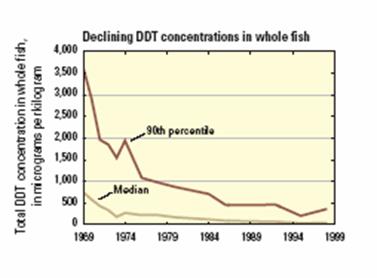
Yes. NAWQA has only begun to look at trends, but early results provide an indication of what to expect. A first look at trends shows examples of both decreasing and increasing levels of certain pesticides in streams and ground water, showing responses to regulatory actions and reduced use. The most complete story of trends is the decline in concentrations of organochlorine pesticides that followed reductions in use during the 1960s and bans on uses in the 1970s and 1980s. Concentrations of total DDT in fish, for example, decreased rapidly from the 1960s through the 1970s and then more slowly during the 1980s and 1990s. Just as notable as the declines, however, is the finding that these persistent organochlorine pesticide compounds still occur at levels greater than benchmarks for fish-eating wildlife in many urban and agricultural streams across the Nation. The decline in organochlorine compounds will continue, but they have long half-lives and we can expect levels to occur above benchmarks in some streams for years or even decades to come.
NAWQA findings also show some examples of trends involving more recently used pesticides. Concentrations of relatively mobile and short-lived pesticides in stream water respond more rapidly to changes in use than the less mobile and more persistent organochlorine insecticides discussed above. For example, increases in acetochlor and decreases in alachlor are evident in streams in the Corn Belt where acetochlor partially replaced alachlor for control of weeds in corn beginning in 1994. The changes in use were reflected quickly in stream concentrations, generally within 1 to 2 years. Similarly, concentrations of diazinon decreased significantly from 1998 to 2004 in 5 of 7 urban and mixed-land-use streams sampled in the Northeast, consistent with the EPA-mandated phase-out of nonagricultural uses of diazinon that began in 2002. More information on the phase-out of diazinon by EPA is available at: http://www.epa.gov/pesticides/op/diazinon.htm .
Ground water responds more slowly than streams to changes in pesticide use—taking years and even decades for changes in quality to occur. A persistent pesticide or degradate can remain in ground water long after its use has been discontinued because of the slow rates of ground-water flow and the resulting long residence time of water and contaminants in ground-water flow systems. This is evident from a number of studies in different parts of the country. For example, bromacil remained at detectable levels in ground water in parts of Florida for several years after it was not longer used, and dieldrin, which is no longer used, was still detectable at concentrations greater than its human-health benchmark in 73 wells sampled by NAWQA.
USGS data and analyses are now sufficiently extensive to support national statistical models that can be used to estimate concentrations or the occurrence of some pesticides in streams and ground water where they have not yet been measured. Expanding this predictive capability is a critical step for national water-quality assessments, as well as for cost-effective management of water resources, because both require more information than can be directly measured.
NAWQA’s WARP (Watershed Regressions for Pesticides) model was developed from measured pesticide concentrations in streams, together with information on pesticide use and land use, climate and soil characteristics, and other natural features. This model can be used to predict the likelihood that the annual average concentrations of atrazine in untreated stream water exceeds specified levels of concern. Atrazine concentrations were predicted to be highest in the Corn Belt and parts of the southern Mississippi River Valley, where use is high and natural features favor the transport of pesticides by runoff to streams. Current modeling efforts involve expansion to other pesticides. A USGS ground-water model was developed to predict the presence of atrazine in shallow ground water within agricultural areas across the Nation, and shows the highest frequencies of atrazine detections in parts of the Midwest, Great Plains, Pacific Northwest, and Mid-Atlantic regions where atrazine is heavily used in hydrologic settings that favor the transport of pesticides to ground water. USGS is working closely with EPA on the development of these predictive tools. Model estimates can be used to identify locations that have the greatest likelihood of elevated pesticide concentrations and that are therefore the highest priority for additional monitoring.
One of the most important gaps to be filled is improved tracking of pesticide use in agricultural and non-agricultural areas, including amounts, locations, and timing. Given the direct relations between pesticide use and occurrence, improvement in the extent, frequency, and quality of quantitative data on agricultural use—and development of comparable and reliable data sources for nonagricultural pesticide use—would have major benefits for assessment and management of pesticides in streams and ground water.
In addition, long-term consistent data for assessing trends is essential for tracking water-quality response to changes in pesticide use and management practices, for providing early warning of unanticipated problems, and for updating and improving models.
Evaluations also are needed to make direct links between management practices—such as irrigation methods, subsurface drains, integrated pest management, and retention of wetlands and buffers—and the concentrations and transport of pesticides in streams and ground water. Field-scale studies have shown that certain management practices can influence pesticides in streams and ground water, but the effectiveness of these practices needs to be systemically assessed at regional and national scales.
Finally, we must dedicate resources to gather ancillary data necessary to interpret pesticides and other water-quality data.. This includes better information on the ecological and habitat condition of the stream, land-use changes, water use, land-management practices, geomorphology and stream networks, geologic setting, and also point-source discharges. Unfortunately, many of these spatial data are lacking. However, these are critical to help put the pesticide information in an improved context
Effective solutions depend on the commitment of a multitude of individuals because nonpoint pollution results largely from everyday activities. This can be a challenge because the consequences of individual actions (such as application of chemicals on lawns and disposal of household chemicals) on the degradation of water resources are not well understood. In addition, in the agricultural community, there is some economic incentive to reduce chemical use and improve application efficiency. But, for individual homeowners who apply chemicals in much smaller quantities and less frequently, there is little economic incentive to optimize the use of chemicals. Excessive application more often than not has minimal economic impact to the individual homeowner, whereas the collective environmental impact can be large.
Improved monitoring of pesticides may require:
In 2001, USGS began its second decade of intensive water-quality assessments and is returning to 42 of the Study Units that were assessed in the first decade from 1991-2001. In this second cycle of studies, NAWQA has expanded its assessment to include new pesticides with high usage in agricultural and populated areas of the country. A major evaluation of trends is planned in the second decade when the Study Units are reassessed and an increasing number of stream and ground-water sampling sites will have had consistent monitoring over a ten-year period. In addition, NAWQA will continue to assess factors and processes that affect pesticide and other water-quality conditions, and examine the linkages among sources of chemicals and other disturbances that degrade water quality, transport of chemicals through the hydrologic system, and potential effects of chemicals and other water-quality disturbances on humans and aquatic ecosystems. The occurrence, trends, transport, and fate will be evaluated at regional and national scales.
Robert J. Gilliom, USGS, Chief, National Synthesis Project, Pesticides
Placer Hall— 6000 J Street
Sacramento, CA 95819-6129
Email: rgilliom@usgs.gov
Phone: (916)-278-3094
Arty Williams, EPA, Associate Director
Enviornmental Fate and Effects Division
1200 Pennsylvania Ave., NW
Washington D.C. 20460
Email:Williams.arty@epa.gov
Phone: (703)-305-7695
Yes. NAWQA is conducting similar national assessments for volatile organic compounds (VOCs) (http://sd.water.usgs.gov/nawqa/vocns/ ), nutrients (http://water.usgs.gov/nawqa/nutrients/ ), trace elements (http://water.usgs.gov/nawqa/trace/ ), and ecology (http://water.usgs.gov/nawqa/ecology/).
All supporting technical information on the monitoring design, sampling methodology, and analyses can be accessed: http://water.usgs.gov/nawqa/pnsp/pubs/circ1291/supporting_info.php
You can retrieve pesticide data associated with the USGS Circular 1291 by accessing: http://water.usgs.gov/nawqa/pnsp/pubs/circ1291/supporting_info.php Downloadable data can be obtained for individual maps, graphs, and tables included in the report. You can also download data on pesticides and other chemical, biological, and physical characteristics for streams and ground water from NAWQA’s data warehouse: http://water.usgs.gov/nawqa/data This data warehouse integrates more than 11 million records on water quality, ecology, and hydrology from the 51 river basins and aquifers across the Nation, 1992-2001.
Explanations are provided for each graphic, map and table, as well as the capability to download the data used in their creation.

![]() U.S. Department of the Interior | U.S. Geological Survey
U.S. Department of the Interior | U.S. Geological Survey
URL: http://water.usgs.gov/nawqa/pnsp/pubs/circ1291/faq.html
Page Contact Information: gs-w_nawqa_whq@usgs.gov
Page Last Modified: Tuesday, 04-Mar-2014 14:44:24 EST
