
Hydrofabrics: what are they and how do we identify them?
What is a hydrofabric?
This data theme description explores the key characteristics of a category of dataset referred to as “hydrofabric” (a digital mesh describing how water moves across the landscape). It is written for hydrologic modelers and geospatial data practitioners who work with models and data related to hydrology who need to understand the key concepts and abstraction of hydrologic geospatial fabrics (hydrofabrics).
In our day to day, we use broadly defined categories to describe everyday things. For example, many of us live in a “house”. The term “house” is a category of building that we associate with certain characteristics. It has one or more bedrooms, one or more bathrooms, a kitchen, etc. and multiple types of houses exist, such as two-story, ranch, etc. There is no specificity implied by the word beyond some vague—yet foundational—ideas of what the term implies. In this sense, hydrofabric describes the implied characteristics of a given collection of data functionally linked to some digital representation of a stream network. Like the term “house” is a type of “building” that generally has “house” characteristics, a “hydrofabric” is a type of “dataset” that generally has “hydrofabric” characteristics. What are those characteristics? Read on…
Why hydrofabrics are not universal
It might seem reasonable to assume that every country has a complete digital representation of its river networks, drainage areas, and waterbodies. In practice, building a hydrofabric requires high-quality topographic and hydrographic source data plus the sustained institutional effort to compile, validate, and maintain it — and many regions of the world lack one or both. Even in places that have a complete hydrofabric, it may only work well for one application and be poorly suited for another: a national water availability assessment needs catchments aggregated to the size of river basins, while a local flood model may require drainage areas just a few hectares in size. No single hydrofabric serves every purpose at every resolution, which is why deriving fit-for-purpose hydrofabrics from stable reference datasets is as important as building the reference datasets themselves.
The “fabric” metaphor
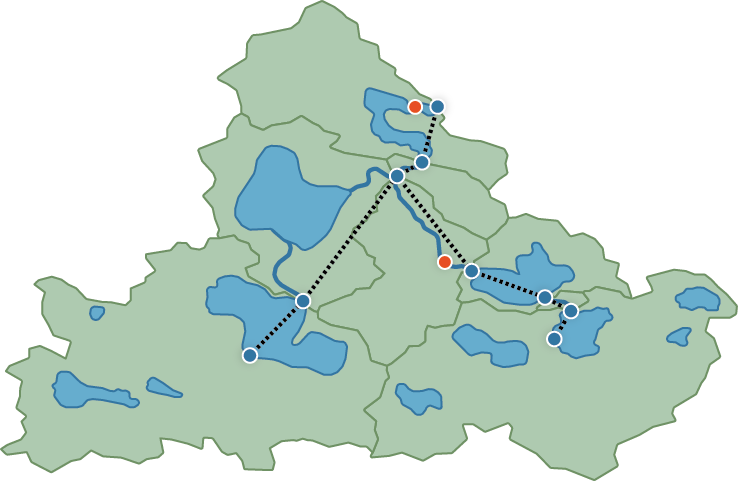
A hydro fabric divides up a landscape according to hydrologic processes and the hydrologic network that conveys water downstream, like a woven mesh laid over the real world. The “fabric” metaphor reflects how two elements are woven together: catchments (land areas where water collects) and flowpaths (connected river networks that move water downstream), creating a continuous coverage with no gaps. Hydrologic locations—such as monitoring stations, dams, and infrastructure—are linked to this fabric, connecting observations and model predictions to specific places on the network. Like fabric woven at different sizes, a hydrofabric can be created at varying levels of detail depending on modeling needs, but always respects how water actually moves through the landscape.
Function of a hydrofabric
In many cases, the key to understanding a thing is to first understand its function. Toward this end, a hydrofabric can fulfill at least four key functions:
- partitioning the landscape into hydrologically meaningful units
- defining how waterbodies connect and route flow downstream
- providing authoritative geometric and physical characteristics of hydrologic features
- establishing a common framework for integrating data from different sources
These are inherent properties that a hydrofabric provides by design. In practice, hydrologic models, analysis, or data systems use part or all of these properties as baseline content from which to incorporate and link new datasets. Because individual model applications or analyses have their own needs, any given use typically draws on a subset of a larger, more complete hydrofabric from which it was derived.
Hydrofabric components
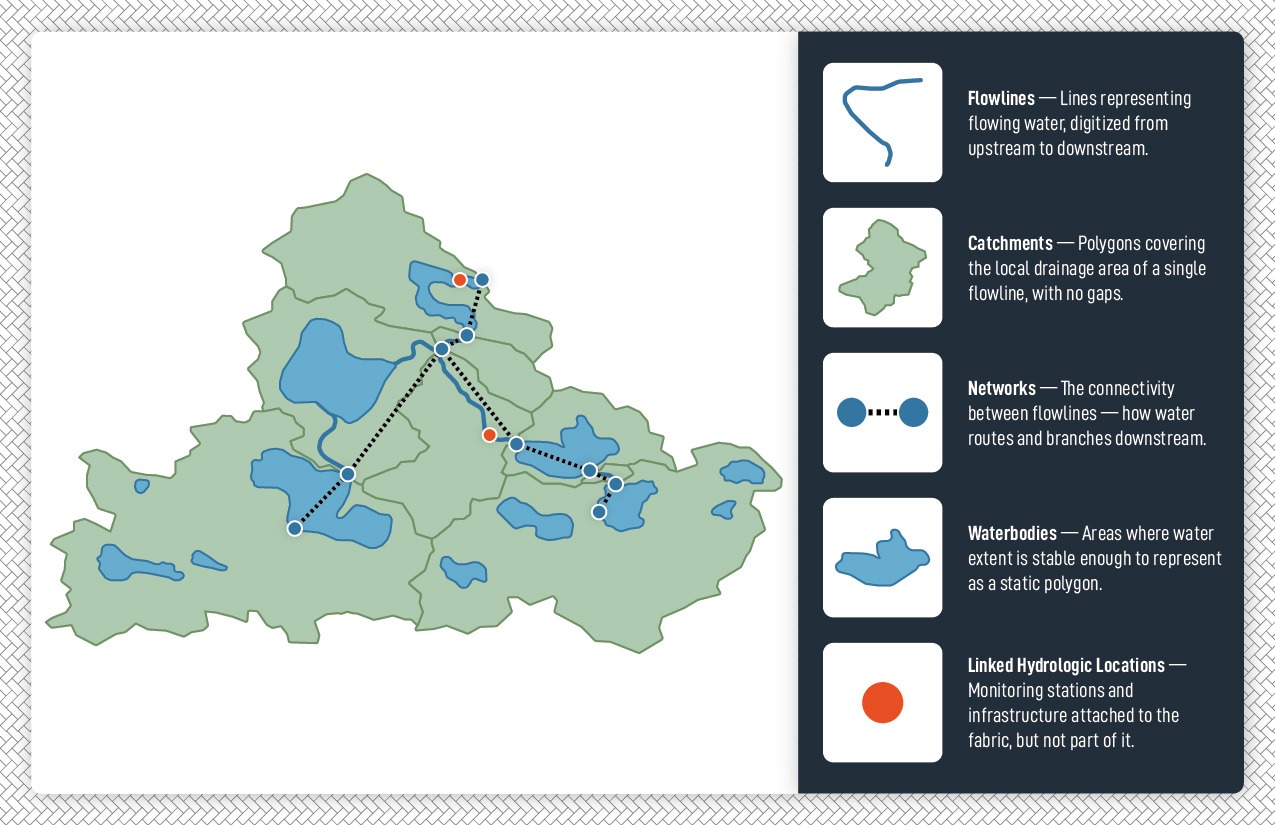
A hydrofabric is made up of five types of components: flowlines, catchments, networks, waterbodies, and linked locations. Like a house has components with a specific purpose, each hydrofabric component serves a distinct role, though they are conceptually separate yet practically related, much like how a back door might be in the kitchen or an attic might double as a bedroom.
Sharing or using published hydrofabric data adds a layer of practical complexity. The way things are packed for shipping is rarely the same as how they are unpacked and used, and hydrofabric data is no different. Components are packaged by geometry type, since geospatial data tables typically store only one type of geometry, but in practice a user may need to combine several tables to answer a single question. Each table maintains a consistent relationship to the others so that reassembling the pieces is straightforward and the data can be combined and transformed without unnecessary complexity.

Flowlines
Flowlines represent flowing waterbodies (including where water may sometimes flow) as lines that are usually digitized from upstream to downstream. They are typically packaged as a single table with a unique identifier, a mainstem identifier, a name attribute, and optionally other attributes. Length may be included but can also be calculated from geometry if the geometry is appropriate for length estimation. If the flowline has a local drainage area (catchment), the area of that catchment may be included as an attribute. In some instances, attributes that indicate upstream-downstream connectivity may also be included.

Catchments
Catchments represent local drainage areas as a continuous coverage of polygons with an identifier attribute and optional physical attributes like drainage area. While a catchment is represented as a polygon, it is a specific type of polygon that encompasses the local drainage area of one and only one flowline, an internally drained area, or an area that flows to a coastline. By the numbers, most catchments have an associated flowline and most flowlines have an associated catchment, but internally drained and coastal catchments do not have a flowline and vice versa.

Network
Networks represent how flowing waterbodies relate to each other, usually implied by how flowline geometry connects. Representing this connectivity in attributes is useful because most uses of hydrofabrics don’t work directly with flowline geometry but need access to network connectivity. It is also useful for expressing connections that exist in the real world but may not be represented as flowlines. Networks are typically packaged as a table of connections with identifiers for upstream and downstream features. When a network includes branching flow, the network also contains information related to whether a given connection is primary or secondary and, if known, what fraction of flow is thought to go to each branch downstream of a diversion.

Waterbodies
Waterbodies represent areas where the extent of water presence is constant enough that a static polygonal representation is broadly useful. Waterbodies fall into two main categories: on-network and off-network, depending on whether one or more flowlines pass through the waterbody. A large lake, for example, may have several flowlines entering it and one exiting, while a small pond with no connecting stream would be off-network. Waterbodies are packaged as a collection of non-intersecting polygons with an identifier and optional physical, categorical, and when available functional attributes.

Linked Hydrologic Locations
Linked hydrologic locations represent monitoring stations, infrastructure, and important prediction points that connect to the hydrofabric but are not inherent components of it. Unlike flowlines and catchments that form the fabric itself, linked hydrologic locations are points of interest that we attach to the fabric to enable data integration and model output. For example, a USGS stream gage measures flow at a specific point, and linking that gage to a flowline allows us to associate observations with the upstream catchments that contribute to flow at that location. Linked hydrologic locations serve as the bridge between the hydrofabric’s spatial framework and the real-world measurements and predictions we need for hydrologic analysis.
Attributes
Practically every model or analysis that uses hydrofabric components requires extended attributes for the flowlines, catchments, network connections, or waterbodies it uses. Flowline attributes include things like slope, hydraulic geometry, roughness, and bed material. Catchment attributes can be any spatial phenomena (land cover, soils, ecology, demography, etc.) that can be summarized to the extent of the catchment polygon coverage. Network attributes include information regarding intermittent connectivity, anthropogenic withdrawals and returns, or storage/discharge dynamics. Waterbody attributes are similarly diverse and, in many cases, specific to the model or analysis at hand.
Every extended attribute of a hydrofabric can be seen as purpose-built to one degree or another. As a result, many extended attributes are compatible with the hydrofabric components but are created for specific purposes and shared for others to reuse in their own applications, rather than being built into the shared hydrofabric components.
Issues of Resolution and Scale
In hydrology, “scale”* refers to the resolution of data in consideration, from a hillslope that drains into a small stream, to a river reach that connects many hillslopes, to a basin that collects flow from many reaches. These levels are not independent: local processes, when combined, shape regional processes. A hydrofabric must represent this hierarchy accurately, and two of its components, incremental hydrologic units and accumulated attributes, present particular challenges because they can only be understood in relation to the broader network around them.
*Spatial “scale”, the size at which a phenomena is observed, is easily confused with “map scale”, the ratio between distance on a map to distance on the ground. For this reason, it can be helpful to think in terms of resolution or granularity instead of “scale”.
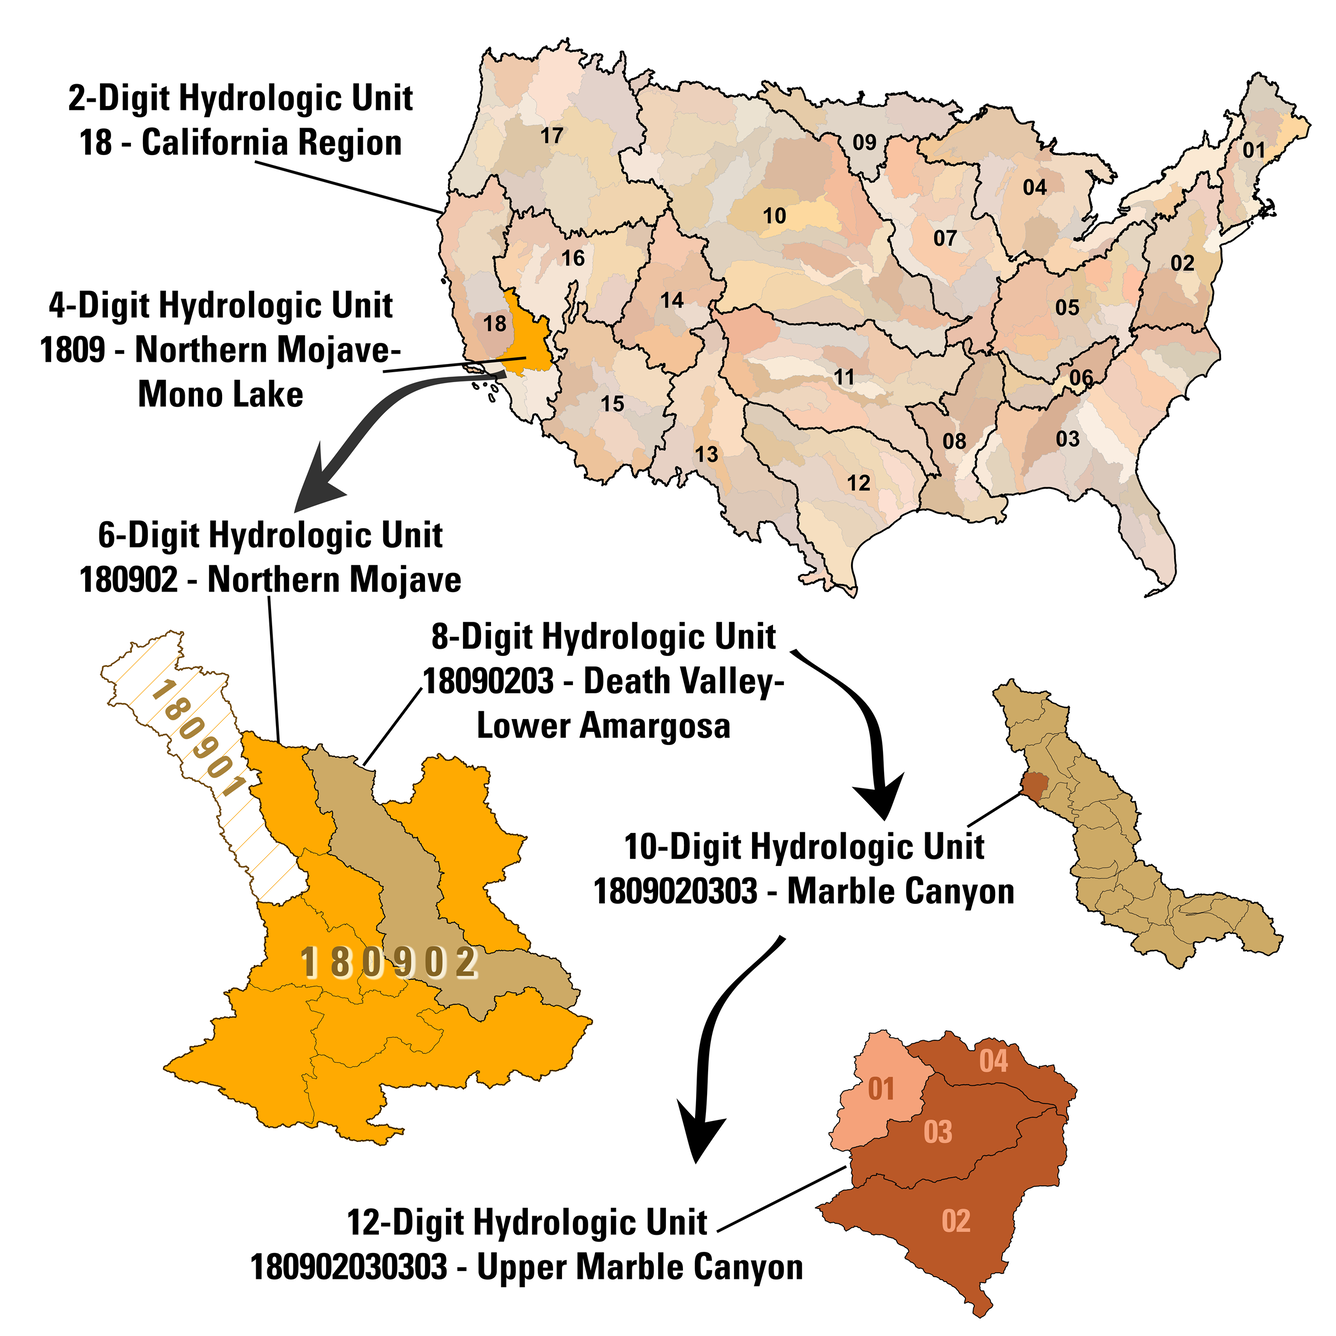
Incremental nested hydrologic units
Incremental nested hydrologic units are polygons that group catchments into progressively larger drainage areas, organized in a hierarchy of nested levels, from small sub-watersheds up to major river basins. Unlike individual catchments, which each represent the local drainage area of exactly one flowline, incremental hydrologic units are delineated to fall within a target size range. This makes them more useful as consistent indexing units for summarizing data across large areas — think of them as a standardized grid for organizing hydrologic information at multiple sizes. The tradeoff is that they can’t follow the strict one-flowline rule that catchments must satisfy, so they are not considered a core hydrofabric component, even though they are derived from catchments.
Because these units are nested, smaller units share boundaries with the larger units that contain them, and editing a boundary at one level can trigger a cascade of updates up and down the hierarchy. This interdependency is one of the practical challenges of working with hydrologic data at multiple resolutions.
Accumulated Attributes (Drainage Area)
An accumulated attribute is a value computed by summing or aggregating information across all the catchments, flowlines, and network connections that drain to a given point. Drainage area is the most familiar example: the total drainage area at any point on a river is the sum of all the catchment areas upstream of that point, traced through the network. Other examples include total upstream stream length or the percentage of upstream land covered by a particular land use type.
What makes accumulated attributes distinct, and worth special care, is that their values depend entirely on which catchments and network connections were used to compute them. Two studies that each report “drainage area” for the same river location may produce different numbers if they used different hydrofabric versions with different catchment boundaries or network connections. This means an accumulated attribute is only directly comparable to other accumulated attributes derived from the same hydrofabric components.
Hydrofabric datasets
From RF1 to 3DHP
Although the term “hydrofabric” was coined in the 2020s, datasets that can be thought of as hydrofabrics have evolved over several decades in the United States. In the 1990s, the EPA “River Reach File 1” (RF1) was established as the first national digital dataset of this kind. It was primarily available as a set of flowlines with network attributes. Numerous projects and modeling applications used the RF1 flowlines and network and built value-added information on top of it (e.g., ERF1 estimated numerous attributes and released them as a single table of flowlines with many associated attributes).
In 2005, NHDPlusV1 was released. NHDPlusV1 combined data from the medium resolution (1:100k map scale) National Hydrography Dataset with a digital elevation model to create catchment polygons. While NHDPlusV1 was not described as a hydrofabric at the time, it can be seen as one in retrospect: it includes all four core components described above and was packaged in regional subsets, each broken down into independent tables roughly as laid out above. NHDPlusV1 was adopted by the National Hydrologic Model Geospatial Fabric and used by many, but was a stepping stone to NHDPlusV2 for most users.
In 2012, NHDPlusV2 was released. NHDPlusV2 follows much the same pattern as NHDPlusV1, with numerous adjustments and improvements based on experience gained working with NHDPlusV1. NHDPlusV2 was adopted for use in EPA national data indexing and summarization utilities and in the USGS National Water Quality Assessment for SPARROW modeling and other national assessment activities. NHDPlusV2 also incorporated drainage basin boundaries from the first national snapshot of the Watershed Boundary Dataset, using those boundaries to enforce consistency between catchment delineations and hydrologic unit boundaries.
Multiple improvements to the NHDPlusV2 network have been created—some released for broader use (NHDPlusV2 network improvements , additional improvements ). While NHDPlusV2 itself includes numerous “value-added attributes” that characterize its features, numerous additional attributes have been created (e.g., NHDPlusV2 catchment attributes ) that further characterize the NHDPlusV2 catchments for use in model applications and other analyses.
In 2022, a complete national snapshot of NHDPlusHR (high resolution) was released. NHDPlusHR used the same methods for catchment delineation as NHDPlusV2 but worked from the high resolution (1:24k or finer map scale) hydrography and newer, higher-resolution digital elevation data. NHDPlusHR data production was challenging to scale up, and using the data with software tools built for NHDPlusV2 stretches the memory and computational capacity of normal computer hardware. As a result, ongoing production and broad adoption of NHDPlusHR has been limited.
In 2024, the USGS released a 3D Hydrography Call to Action , which marks the end of development of NHDPlusHR and the beginning of a complete redevelopment of hydrography for the US. The 3D Hydrography Program (3DHP) aims to produce flowlines that follow the actual shape of the terrain as captured by a digital elevation model (DEM), with accurate elevation values attached to each point along the flowline. This is a departure from earlier NHDPlus datasets, where flowlines do not always agree with elevation contours. At the time of writing in winter 2026, the 3DHP has incorporated several small regions of elevation-derived hydrography data into the national baseline and will be in active data production for some time.
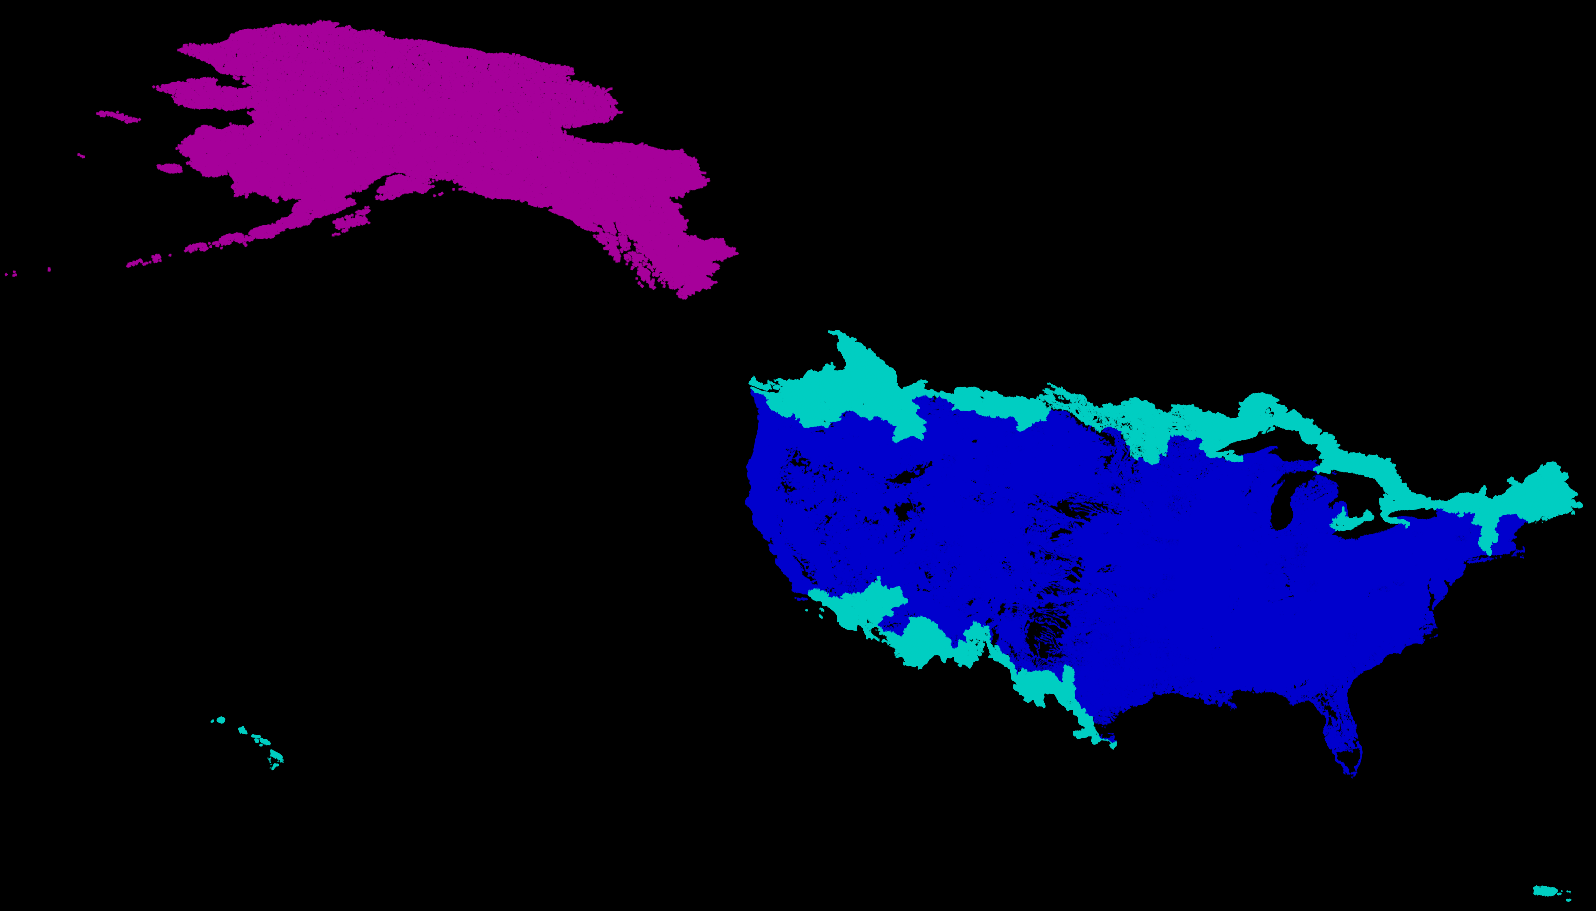
Unlike its predecessors, 3DHP flowlines are derived algorithmically from 3D Elevation Program (3DEP) LiDAR (ifsar in Alaska) data rather than digitized from topographic maps, resulting in denser stream networks that are more consistent with the terrain surface. The 3DHP product consolidates capabilities of NHD, WBD, and NHDPlusHR into a single z-enabled dataset—where every feature carries elevation values. 3DHP is also built using concepts from the HY_Features international hydrologic features data standard and integrates into the Internet of Water through geoconnex.us .
Additional background and historical detail about these hydrographic datasets can be found at the 3DHP Abridged History of Hydrography Datasets .
The Watershed Boundary Dataset (WBD)
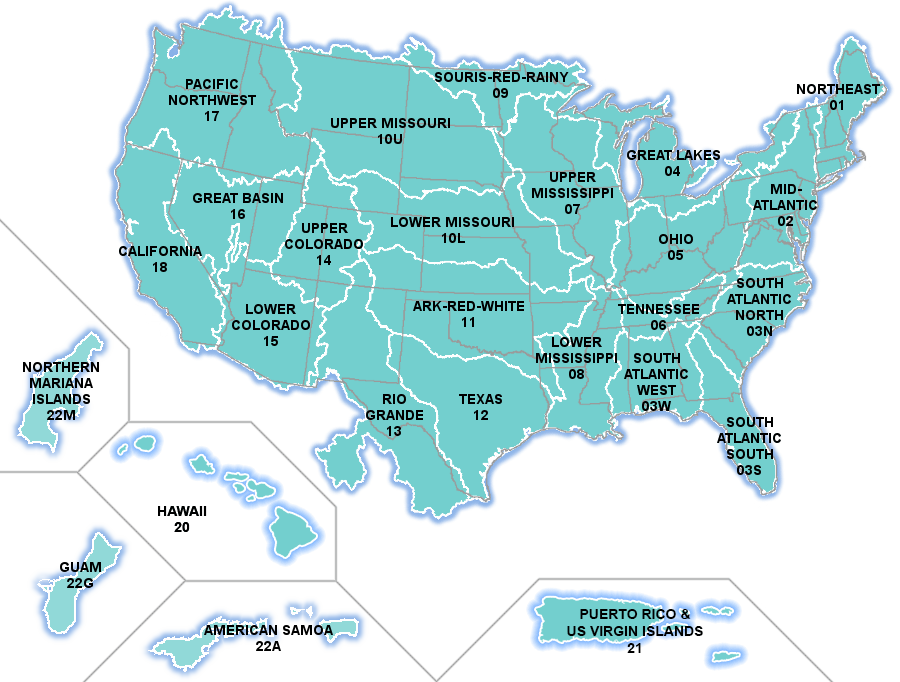
The WBD is the primary example in the United States of the incremental nested hydrologic units described in the Issues of Resolution and Scale section above. The hydrologic unit code system, introduced in USGS Water Supply Paper 2294 first published in the mid-1980s, establishes a nested identifier system for hydrologic boundaries. Quoting from Water Supply Paper 2294:
Federal and State agencies, Congress and its committees, the “Federal Register,” treaties, compacts, adjudications, Presidential Executive orders, river-basin commissions, and others used many incompatible criteria for names, codes, hydrographic boundaries, and river basins (Kammerer, 1969). After many years of use of unsatisfactory and inadequate hydrologic maps, discussions among representatives of Federal and State agencies, initiated in 1972, led to nearly unanimous agreement on the need for a national project to develop uniform and widely acceptable hydrologic boundaries and to present them on nationally consistent base maps. A need for standardization of hydrologic units was evident throughout the country. — Kammerer, J.C., 1969, Delineation of major water regions in the conterminous United States, 1908-68: U.S. Geological Survey, Water Resources Review, January 1969, p. 10 (not available online)
In 2009 (and five subsequent editions up to 2022), the current WBD delineation rules were published, superseding previous guidance on delineation of hydrologic unit boundaries as originally described in Water Supply Paper 2294.
Watershed Boundary Dataset hydrologic units don’t follow the core catchment assumption of one inflow and one outflow, and they do not have flowlines. From that perspective, hydrologic units alone are not a hydrofabric component. To further illustrate this point, some hydrologic units are actually large waterbodies. However, WBD hydrologic units are usually delineated with one and only one outflow such that each unit has one and only one downstream hydrologic unit. Using the location where hydrofabric flowlines cross hydrologic unit boundaries as an outlet, hydrologic units can be linked to a hydrofabric such that hydrofabric data can be summarized according to WBD hydrologic units.
Between the mid-1980s and 2024, the WBD was incrementally refined and improved. Since around 2005, the twelve-digit (the sixth level of hydrologic unit hierarchy) hydrologic units have been the subject of especially active development with an eye toward hydrofabric integration. Four WBD snapshots were established in this period and are used to varying degrees:
- NHDPlusV2-WBD
- WBD-2020
- NHDPlusHR-WBD
- WBD-2024
The NHDPlus snapshots are actually composed of content taken from the WBD through time, corresponding to the timeline of regional data production of the related NHDPlus data. NHDPlus used WBD boundaries as “walls” that were enforced in digital elevation to force catchment boundaries and hydrologic unit boundaries to coincide.
The two year-based snapshots correspond to complete point-in-time snapshots of the WBD. The 2020 snapshot was taken for the first USGS National Water Availability Assessment , and the 2024 snapshot was taken when WBD edits outside of Alaska ended in 2024.
More information and maps of the WBD snapshots are available at the Hydrologic Units data theme.
Reference and Derived Hydrofabrics
In practice, hydrofabric datasets get used and reused in hydrologic studies and model applications. Once a given dataset has been used more than once, the results of the studies that used it can be said to derive from it. To some degree, the source dataset that has been reused becomes a “reference” dataset. Using this framing, we can think of some hydrofabric datasets as “reference” and others as “derived”.
With the broad-use and reuse of NHDPlusV2 as a reference hydrofabric, it is clear that establishing stable reference hydrofabric datasets is of significant value.
Reference means two things here
Reference framework (like latitude/longitude coordinates) uses “reference” in the sense of a standard grid for locating things. It’s the fixed framework against which other things are positioned or defined. The reference itself is the anchor point or set of rules.
Reference dataset uses “reference” as an adjective meaning authoritative or canonical — the version you refer back to when you need the definitive source. It’s the thing others are compared against, not the framework for comparison.
So in the first case, “reference” describes the nature of the system (it provides a basis for locating things). In the second, it describes the status of the version (it’s the one to be referenced).
Geospatial Fabric V1 and V2
The USGS National Hydrologic Model Geospatial Fabric (GF) V1 was released in 2014 (doi:10.5066/F7542KMD ).
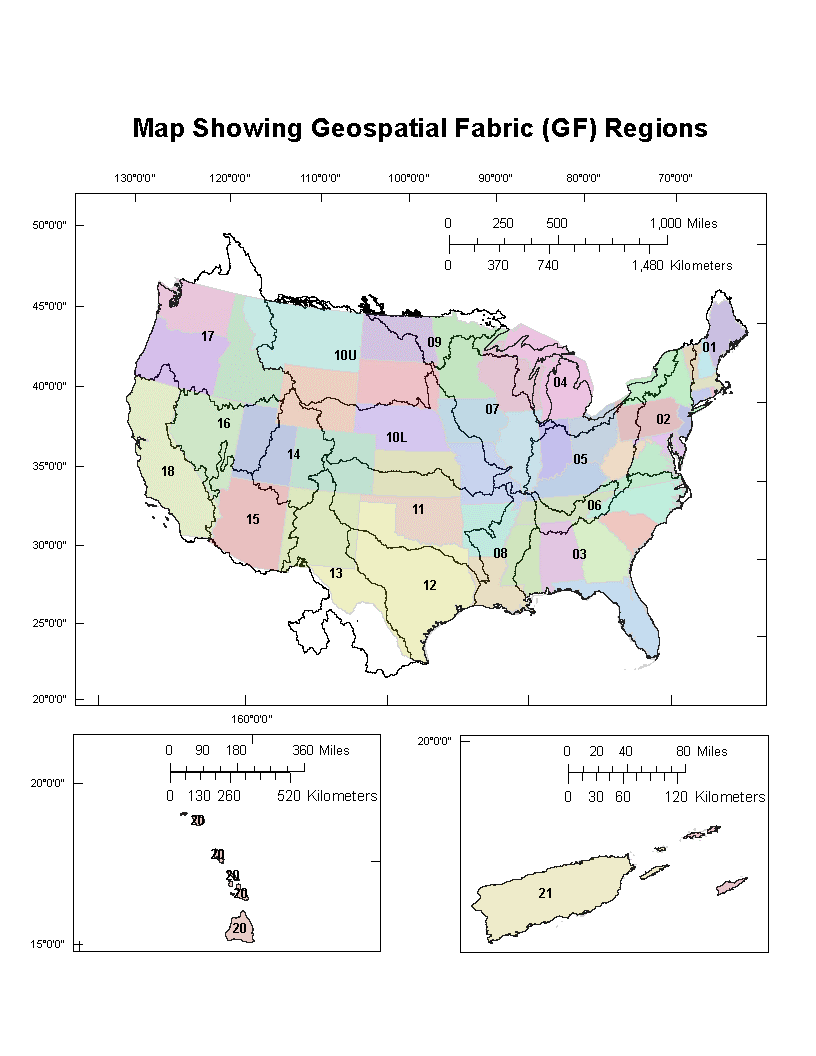
In 2021 it was updated with numerous fixes and the addition of US/Canada and US/Mexico transboundary basins as GFv1.1 (doi:10.5066/P971JAGF ). Alaska (doi:10.5066/P13FOGMM ) and Hawaii (doi:10.5066/P9HMKOP8 ) were added under the GFv1.1 version in 2024. GFv1 derives from several independent reference hydrofabric datasets (NHDPlusV1 in CONUS, NHDPlusHR in Hawaii and transboundary areas, and MERIT Hydro in Alaska).
GFv2 (provisionally available in Winter 2026 at ScienceBase ) builds on the GFv1 paradigm and adds an explicit separation between “reference” and “derived” hydrofabric datasets. For GFv2, pre-processed “reference fabric” components are saved and distributed in such a way that any study or model application can derive from the same baseline reference dataset(s). Each successive GF version has been shaped by needs and improvements identified by the community of users of the previous version, as well as updates available in the underlying source datasets. Other USGS national-domain projects, such as SPARROW, have derived their own modeling hydrofabrics to handle the specific requirements of their analyses.
National Hydrologic Geospatial Fabric
The National Hydrologic Geospatial Fabric (NHGF) is a strategic USGS effort to steward the system of data and cyberinfrastructure required to systematize and maintain reference hydrofabric data, linked content, and the tools needed to produce and distribute hydrofabric datasets. Rather than treating hydrofabric development as a series of independent projects, the NHGF establishes a coordinated program that maintains stable reference datasets, provides tools for deriving application-specific hydrofabrics, and ensures compatibility across different modeling frameworks and data systems.
The NHGF recognizes that different stakeholders need different hydrofabric configurations, some need fine resolution for local and regional modeling while others need coarse resolution for national-scale assessments. By maintaining a common reference framework and providing tools to derive fit-for-purpose hydrofabrics from it, the NHGF enables diverse applications while ensuring they remain compatible and comparable. Importantly, the NHGF also provides a path for regional and domain-specific users to contribute enhancements and customizations developed in their own applications back into the shared system, so that improvements made for one purpose can benefit the broader community.