![]()
Adoption of the new reporting procedure places responsibility for using and presenting final data with the user rather than with the laboratory. Moreover, adoption of the new procedure results in significant benefits to the data user. Decisions about whether the intended use of the data merits censoring can be made by the user. If the intended use does not merit censoring, uncensored data are available for interpretation and statistical analysis. Thus, informed use of these data requires knowledge of the project data-quality objectives—the intended data use, the anticipated future uses of the data, and the effect of data certainty on the intended data interpretations.
Effect of Censoring on Data Distribution
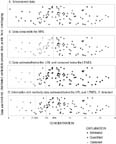
A one–dimensional scatterplot shows how the different censoring methods—that is, MRL, LT–MDL, LRL, information rich—affect the distribution of a hypothetical data set (fig. 11). The x-axis scale is concentration, and data are randomly distributed vertically so that overlapping data points are easier to see. The uncensored data set includes values that range from about -3 to 22 (fig. 11A). These are hypothetical uncensored values, including negative values, as they would be read directly from an analytical instrument before reporting criteria have been applied by the laboratory. When data are censored to the MRL by the laboratory, all the values less than the MRL (in this example the MRL=8) are reported as <MRL. These censored concentrations have an unknown distribution less than the MRL as indicated on the graph by symbols with gray shading (fig. 11B). When the data are censored according to the new reporting procedure (in this example, the LT–MDL=3 and the LRL=6), values between the LRL and the LT–MDL are reported as estimated, whereas the values less than the LT–MDL are censored and reported as <LRL (fig. 11C). In essence, what is known about the low end of the concentration distribution is extended compared to what is known about this concentration distribution when data are reported by using the MRL reporting procedure. For information-rich methods, only samples that produce no signal or fail identification criteria (qualitative non-detections) are censored and reported as <LRL. Concentrations of all other qualitatively detected analytes that are less than the LRL are estimated. This extends what is known about the low end of the distribution below the LT–MDL as shown in figure 11D.
 |
|
Figure 11. One-dimensional distribution plots of (A) uncensored data and the same data set censored by using (B) the MRL procedure, (C) the new reporting procedure, and (D) the new reporting procedure for information-rich methods. Censored data are reported as less than the censoring level. [MRL, minimum reporting level; LRL, laboratory reporting level; LT–MDL, long-term method detection level] |
Compared to historical USGS data reported by using the MRL convention, the new low-concentration reporting conventions described in this document result in important differences in the way data are reported to the data user and in the way data and data sets can be used and interpreted. The new low-concentration reporting conventions also require that the user have a clear understanding of the limitations of analytical detection at low-concentration ranges. Consider that:
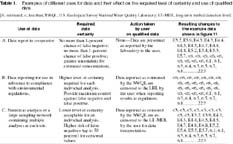
Given these four conditions that result from the new reporting procedure, users must know and understand the level of data certainty required by project goals in order to appropriately analyze these data to meet project goals. Based on project data-quality objectives and knowledge of the basis for estimated and censored concentrations in the project data base and the effect of concentration qualifiers on planned data interpretations, the user can choose how to use qualified data (table 1). For a data report, data should be listed as reported by the NWQL with no user modification of qualified data. Using the example data set in figure 11, the 14 values that fall between the LRL and LT–MDL were reported as estimated concentrations, the 9 values that are less than the LT–MDL were reported as <6, and the values greater than the LRL remain unqualified.
When examining an individual concentration as a basis to assess compliance with environmental regulations, a high degree of certainty is needed to account for the possibility of reporting a false positive or false negative concentration. That is, the user does not wish to report that a potential contaminant is present when it is not or that the analyte is absent when, in fact, it is present. The user may choose to increase data certainty by ignoring estimated concentrations and censoring all data at the LRL, at a higher historic MRL, or at any other project-specific level that is greater than the LRL. For example, in table 1, all estimated data in the example data set were censored to <6.
 |
|
Table 1. Examples of different uses for data and their effect on the required level of certainty and use of qualified data |
Either way, the user must decide how to handle censored data—in many cases, data censored to multiple reporting levels—and estimated data that are based on the data-quality objectives of the study. The new reporting procedure is not the first to produce data sets with censored data and with multiple reporting levels. The USGS has been interpreting these types of data sets for many years. However, with the exception of the reporting procedure for selected methods used by the NAWQA program, it is the first reporting procedure at the NWQL to produce estimated concentrations that are less than the reporting level on a large scale. Since 1992, the NWQL has been providing estimated values below the reporting level for several information-rich methods that were developed to support the NAWQA program (schedules 2001/2010, Zaugg and others, 1995; schedules 2050/2051, Werner and others, 1996; schedules 2020/2021, Connor and others, 1998).
Various techniques for statistical analysis of censored data have been developed and used. A simple approach to statistical analysis of censored data is substitution with 0, the censoring level, or one-half the censoring level. Other more robust methods exist for handling data analysis of censored and multiple censored data (Helsel and Hirsch, 1992; Clark and Whitfield, 1994; Clarke, 1998). These methods can be used for data reported with the new reporting procedure and include distributional methods, such as maximum likelihood estimation and probability plotting procedures, and robust methods to extrapolate censored values that are based on data above the censoring limit. The performances of these methods have been compared and found to differ substantially (Gilliom and Helsel, 1986; Helsel and Gilliom, 1986).
Most of these methods have advantages and disadvantages. Substitution has only the advantage of simplicity; it has been shown to perform poorly relative to other more theoretically based methods, which result in bias, either high or low depending on the value substituted (Helsel and Hirsch, 1992). Distributional and robust methods have been widely used in the USGS, and some software already exists to perform these methods. Probability plot methods can be computed with standard statistics software. Distributional methods depend, however, on the assumption that the data fit an assumed distribution. In addition, data may be subject to transformation bias. For robust methods, the distribution of data above the censoring level is used to extrapolate values below the censoring level, providing the advantage that the distribution is based on observed data rather than assumed. Both the distributional methods and robust methods work poorly with small sample sizes.
Multiple censoring levels also complicate data analysis. Most simply, data with multiple censoring levels may be set to the highest reporting level in the data set. By use of this simple approach, estimated and quantified concentrations less than the reporting level also would be censored. Assuming that year-to-year changes in the LRL are small and that the LRL’s are not substantially different from the historical MRL, setting quantified data to higher censoring levels may not result in a severe loss of information. However, if the difference between the historical MRL and new LRL is large, if year-to-year changes in the LRL are large, or if many estimated values must be censored, significant loss of information could occur. For these reasons, resetting data to the highest reporting level often is not an appropriate approach.
A unique consideration posed by data produced with the new reporting procedure is that the censoring level (LRL) is greater than the level used to determine when values should be qualified as estimated (LT–MDL). Consequently, the use of distributional or robust methods to extrapolate data censored to the LRL within the range of 0 to the LRL will result in a positive bias. This is because only measurements that are either less than the LT–MDL or non-detections are reported as <LRL. The censoring level must be viewed as a reporting level and should not be used to determine the upper limit for methods of extrapolation. Instead, the user should use the LT–MDL as the appropriate upper limit for extrapolation of censored values when using distributional or robust methods for interpretation of censored data. Improved statistical techniques and new software need to be developed to provide data users with an easy method to handle this and other multiple reporting-level issues.