NEW REPORTING CONVENTIONS
New reporting conventions were applied to four methods beginning October 1,
1998 (U.S. Geological Survey National Water Quality Laboratory Technical Memorandum
98.07, 1998) and will be applicable to selected high-demand NWQL water methods
beginning in fiscal year 2000. For all methods, the new reporting conventions
allow reporting of analytes detected at concentrations less than the LRL and
as low as the LT–MDL, whereas non-detections are reported as <LRL. [Note:
the LRL previously was called non-detection value or NDV (Connor and others,
1998: U.S. Geological Survey National Water Quality Laboratory Technical Memorandum
98.07 1998), a term that is no longer used.]
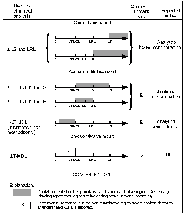
The new low-concentration reporting conventions are outlined in figure 10.
Conventions are shown for situations where the analyte is detected (shading)
in the quantitative region and in the semiquantitative region above and, for
information-rich methods, below the LT–MDL. Also shown are situations where
the instrumental response is in the non-quantitative region where analyte detection
is unclear and <LRL is reported. Conventions are shown for methods where
the lowest calibration standard (LS) concentration is greater than or less than
the LRL. Decreasing shading represents regions of increasing measurement uncertainty.
At concentrations less than the LRL, the risk of a false negative increases
rapidly, and calibration standards with concentrations less than the LRL often
may not be detected. Therefore, the LS used for quantitation typically will
be at a concentration equivalent to or greater than the LRL. Realistically,
data users should expect that analyte concentrations much less than LRL would
not be consistently detected in samples over time. Additionally, the lower the
reported result in relation to the LRL or the LS, the less accurate the measurement
is likely to be. For this reason, the NWQL is qualifying all reported concentrations
less than the LRL or the LS, whichever is higher, as estimated using an “E”
remark code. Reported concentrations that are greater than the highest calibration
standard also will receive an “E” remark code. The “E” remark code will be added
to all values falling outside (above or below) the calibration range because
of increased measurement uncertainty. The “E” remark code will not be used for
values reported for analytes that are diluted into the calibration range and
re-analyzed.
|
|
image size 40KB-gif
Figure 10.
New low-concentration reporting conventions showing the reported value
and associated qualifying remark code in relation to the long-term
method detection level (LT–MDL), the laboratory reporting level
(LRL), and the lowest calibration standard (LS). [> greater
than or equal to;< , less than; E, estimated]
|
Information-Rich Methods
Analytical results for information-rich methods will follow slightly different
reporting conventions. The NWQL has categorized the following instrumental techniques
as information-rich methods for organic chemical analyses.
- Gas chromatography with mass spectrometry (GC/MS); for example,
- Volatile organic compounds by GC/MS (NWQL analytical schedules 2020/2021;
Connor and others, 1998),
- Pesticides in water by C-18 solid-phase extraction GC/MS (schedules
2001/2010; Zaugg and others, 1995),
- Organonitrogen herbicides in water by C-18 solid-phase extraction GC/MS
(schedule 1379; Sandstrom and others, 1992),
- Base-neutral/acid extractable compounds by GC-MS (schedule 1383; Wershaw
and others, 1987)
- High performance liquid chromatography with mass spectrometry (HPLC/MS);
new methods under development.
- High performance liquid chromatography with photodiode array ultraviolet/visible
spectroscopy (HPLC/DAD); for example,
- Pesticides in water
by Carbopak-B solid-phase extraction with analysis by HPLC/DAD (schedules 2050/2051;
Werner and others, 1996).
These method types have qualifying information provided by the detector, in
addition to signal and retention time matching, that enhance analyte identification.
For mass spectral methods, the presence of characteristic mass spectral ions
with correct ion ratios augment analyte identification. Characteristic absorption
spectra are used to enhance analyte identification in photodiode array detection.
Because qualitative identification is required before a concentration is reported,
information–rich methods will not be restricted to censoring all measurements
below the LT–MDL. Therefore, information-rich methods will report estimated
(“E” remark code) concentrations for all positively identified analytes below
the LT–MDL if other quality control criteria, especially laboratory blank-related
criteria, are met. Because data below the LT–MDL have an increased risk of false
positives, data users should carefully examine these reported concentrations
with respect to both laboratory and field blank data.
Additional reasons underlying the reporting changes are detailed in previous
sections. The effect of potential yearly changes of LT–MDL’s and LRL’s in the
USGS National Water Information System (NWIS) data base are discussed in the
sections, “Considerations for Data Interpretation” and “Storing Data in the
National Water Information System” that follow.
Use of the “E” Remark Code by the National Water Quality
Laboratory
The “E” remark code currently (1999) is used to signify that a measured concentration
is estimated by the NWQL. The availability of remark codes in the NWIS data
base is limited. A wide variety of conditions can justify evoking the “E” remark
code other than those conditions shown in figure 10. Furthermore, some “E” coded
values are more uncertain than others. For example, the “E” code also is used
by the NWQL under the following conditions:
- Result was extrapolated above the calibration curve.
- Data quantification was not performed according to method-specific criteria.
- Performance of the analyte does not meet acceptable method-specific criteria.
(Analytes that rarely meet criteria are permanently “E” coded.)
- Deviation from the standard operating procedure was required.
- Some moderate
losses occurred in sample preparation but were not quantifiable.
- Moderate matrix interference conditions occurred. (Severe matrix interference
results in raised reporting levels or deletion.)
 |
Planned implementation at the National Water Quality Laboratory |
 |
Setting The Reporting Level |
 |
U.S. Geological Survey Open-File
Report 99-193 |
