Office of Surface Water Information -- Publications

(DRAFT)

Quality Assurance of U.S. Geological Survey Current Meters

(DRAFT)


Abstract

The Meter-Exchange Program has resulted in the testing of 104 Price AA current meters and 104 Price pygmy current meters since its inception in 1988. A disturbingly large percentage of these meters have failed to meet the criteria for the standard ratings--35 percent of the AA meters and 20 percent of the pygmy meters. Although the amount that the meters performance departed from the standard ratings was small (almost all AA meters were within 2.3 percent and pygmy meters within 5.0 percent), a meter that is off the standard-rating creates a bias in the stage-discharge relations that it is being used to maintain and develop. This bias should be reduced or eliminated, if it is reasonable to do so. An expansion of the Meter-Exchange Program is recommended, as is better training for hydrographers in the care and maintenance of current meters.

Introduction

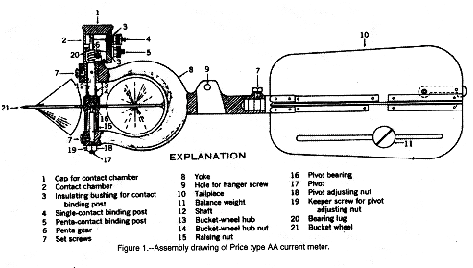
The U.S. Geological Survey (USGS) principally uses two kinds of current meters for measurements of streamflow, the Price type AA meter (with some variations in configuration) and the Price pygmy meter. These vertical-axis current meters have conical cups mounted on a wheel, which rotates in moving water. The speed of rotation is a precise indication of the velocity of the water that impinges on the cups. Figure 1 is an assembly drawing of a AA current meter. A pygmy meter, which is similar, is smaller, does not have tail fins, and has no penta-count mechanism.

AA Current Meter

The AA meter is capable of accurately measuring a larger range of velocity, both lower and higher, than the pygmy meter. The smaller pygmy meter is used for shallower depths. An experienced hydrographer can obtain accurate measurements of discharge, using the velocities obtained with the appropriate meter, ofa wide and varied range of open-channel flow conditions, ranging from a mighty river in flood to a virtual trickle of water in a ditch.

Thus, these current meters form the basis for the accuracy of the discharge data that the USGS publishes through various media. These discharges--which are used for flood warning and prediction; design of bridges, dams, and levees; legal agreements and compacts; planning; regulation; and research--have a reputation for high accuracy. It is very much in the interest of the USGS, the users of the data, and the country to preserve this reputation by continuing to provide discharge data of high and verifiable accuracy.

Rating of Current Meters

The USGS uses, with few exceptions, a standard rating for each type of current meter. These rating are equations that relate the rotational velocity of the current meter to the velocity of the water. A pair of equations define the range of velocities for AA meters. These equations, by convention and statistical evidence, have a common point, where they are joined at 2.2 feet per second, which is 1 revolution per second. The range of velocities for pygmy meters are defined by a single equation. These equations are converted to look-up tables for use in the field. Using a current-meter rating table, a hydrographer can convert observations of the number of revolutions of the meter in a certain number of seconds to water velocities.

Prior to 1980 for pygmy meters and 1970 for AA meters, each USGS current meter was rated separately and was issued with an individual rating table. Smoot and Carter (1968) showed that, within groups of meters from each of three manufacturers, an average (standard) rating gave nearly as accurate results as individual ratings. Subsequently, Schneider and Smoot (1976) demonstrated for pygmy meters that little additional error (generally a fraction of 1 percent) resulted from using a standard rating rather than individual meter ratings.

These, and other resultant investigations, opened the opportunity for costs savings: If meters could be made to tolerances that assured nearly identical physical dimensions, and consequently performance, among the various manufacturers, then a random sample of each batch of meters received from a manufacturer would have to be tested, avoiding calibrating every meter in the batch.

The USGS calibrates 10 percent of the meters received in a batch from a manufacturer, using a tow tank at the Office of Surface Water Hydraulic Laboratory at Stennis Space Center, Mississippi. (The number of revolutions are counted for each of two, three, or four meters as they are pulled through a long tank of still water over very precisely measured distances and times. This process is repeated until all meters in the sample have been tested in the tow tank.) If one meter from the sample fails to match the criteria established for meter accuracy, another 10 percent is tested. If there is one or more failures in this sample, the entire batch of meters is tested, with only those that meet the accuracy criteria being accepted. (Written communication, Eugene C. Hayes and Dennis R. Meyers, USGS Hydrologic Instrumentation Facility.) The accuracy criteria are as follows:

Price type AA current meter Price pygmy current meter
Velocity, in feet
per second
Accuracy, in percent
of standing rating
Velocity, in feet
per second
Accuracy, in percent
of standard rating
0.25
+/-6.0
0.25
+/-6.0
0.50
+/-3.4
0.50
+/-3.4
0.75
+/-2.5
0.75
+/-2.5
1.10
+/-2.0
1.50
+/-1.8
1.50
+/-1.5
2.20
+/-1.5
2.20
+/-1.1
3.00
+/-1.5
5.00
+/-1.1


8.00
+/-1.1


These criteria are based on much experimental data and have a statistical basis. The criteria for the AA meter range from about 2 to 3 standard deviations, of published meter-test data (Smoot and Carter, 1968, and Schneider and Smoot, 1976), and for the pygmy meter from about 1.3 to 2 standard deviations (W.H. Kirby, written communication).

The Canadian counterparts of USGS, in Environment Canada, do not use standard ratings. Although they also principally use the AA and pygmy meters, the Canadians feel it necessary to individually rate each meter. Each meter they use is recalled to their hydraulic laboratory in Burlington, Ontario, to be rebuilt and re-rated every 3 years. This laboratory also performs this function for meters owned by the provinces, hydro-power companies, and others.

Contribution of Instrument Error to Discharge-Measurement Error

Sauer and Meyer (1992) found that most measurements of discharge by current meters will have standard errors ranging from 3 to 6 percent. Poor conditions or improper procedures, however, can result in much higher errors. Instrument error is only one of several significant errors that may contribute to the overall error of a discharge measurement.They cited other important sources of error to include the measurement of depth, pulsation of flow, vertical distribution of velocities, measurement of horizontal angles, and computations involving the horizontal distribution of velocity and depth (insufficient number or poor choice of measuring subsections).

These authors computed the error of a discharge measurement by taking the square root of the sum of the squares of the individual errors contributed by the sources they identified. The error associated with the current meter, which they termed as "instrument error", was relatively small for AA meters used in good conditions and with the best techniques. For pygmy meters the instrument error was a little higher but still relatively small. Their analysis properly used one standard error, which is one standard deviation of the experimental data. They did not consider the case of a meter that is near to or exceeds the calibration criteria, contributing an error up to about four time larger.

In poorer conditions, where the velocity is slow, Sauer and Myer found meter error to be a large source of error in respect to the other sources. Here again, they used the standard error--not several standard deviations--as the instrument error.

The errors associated with individual discharge measurements contribute to the error of the rating curve, the relationship between stage and discharge, for a gaging station. The rating curve error is reflected directly in the discharges that are published.

If several meters were employed in the development of the rating curve, random instrument errors would counter each other. This rarely happens in practice; however, often long periods go by when predominately one meter is used to define the rating curve. Thus, the bias created by an erroneous meter is of concern as well as the magnitude of the error.

Meter-Exchange Program

In 1988 the Office of Surface Water began the Meter-Exchange Program. The program was to select meters being used in the field for re-calibration in the hydraulic laboratory tow tank. The purpose was to learn the accuracy of current meters as they are actually used. The meters were selected by members of surface-water review teams as they periodically reviewed the technical programs in district offices. The team members were asked to either select the meters at random or, if a particularly bad looking meter was discovered, on the basis of appearance.

Current meters received in the laboratory, following a district review, were tested without adjustment or repairs. These data were retained as representative of the accuracy of meters being used in the field. Afterwards, the meters were repaired, adjusted, and re-calibrated to ensure they fit the standard rating. Then, the meters were used to exchange for other current meters selected during district reviews. This program has continued until the present (1997).

Failure Rate

Through 1996, the meter-exchange program has resulted in the testing of 104 AA and 104 pygmy meters. The results of the testing are that 36 AA and 21 pygmy meters failed to meet the standard rating criteria. The failure rate is 35 percent for AA meters and 20 percent for pygmy meters, unacceptably high rates of failure. Assuming that the data are distributed normally around the meter rating equations and that the standard-rating criteria is, for practical purposes, 2 standard deviations, then only about 2 percent of the current meters should fail.

When these results became known, there was concern that the selection of meters that appeared to be in poor condition were biasing the results, making failure rate appear higher than would be typical for current meters being used in the field. To investigate this concern, the test data were divided into three groups: meters selected at random, those selected non-randomly because of appearance, and those for which there is no information concerning the basis for selection. These data are summarized in table 1.

Table 1: Statistics for Meter-Exchange Program through 1996

METERS SELECTED AT RANDOM
Meter Type Pass Fail Percent Failing
AA
51
26
34
Pygmy
61
18
23

METERS HAVING NON-RANDOM SELECTION
Meter Type Pass Fail Percent Failing
AA
9
7
44
Pygmy
10
2
17

METERS HAVING UNKNOWN SELECTION CRITERIA
Meter Type
Pass
Fail
Percent Failing
AA
8
3
27
Pygmy
12
1
8

There appears to be little statistical difference in the failure rate among the meters in the three categories above. Visual inspection of the physical appearance of a meter is not a good predictor of whether it will fail to meet the standard-rating criteria. According to the manager of the hydraulic lab (oral communication, Kirk G. Thibodeaux), even a spin test of a meter is not a good indicator of whether it will pass or fail. He cites instances of AA meters that had timed spin tests of about 30 seconds, well below the minimum standard of 1 minute 30 seconds, that met the standard rating criteria.

Departure from Standard Ratings

The AA meters in table 1 that failed to meet the criteria had an average departure from the standard rating of 1.76 percent at the velocity at which they failed to meet the criteria by the maximum amount. The largest departure was 2.7 percent. Underregistration of velocity was a problem for 30 AA meters, while 6 overregistered. None of the AA meters failed at a velocity of less than 0.75 feet per second. They tended to have the worst failures to meet the standard-rating criteria at the higher velocities (2.2 feet per second and above).

In contrast, the 21 pygmy meters that failed had an average departure from the standard rating of just over 5 percent at the velocities at which they exceeded the criteria the most. Except for 4 of the 21 pygmy meters that failed, they all failed at higher velocities, 0.75 feet per second and above. Ten of these meters overregistered, while seven underregistered. The other four pygmy meters failed at low velocities, underregistering from 6.5 to 23.2 percent. In contrast to the other pygmy meters and the AA meters, these four pygmy meters also failed to meet the standard rating criteria throughout much of the tested range.

As with the failure rates, maximum departure from the standard ratings was not sensitive to whether the meter-selection criteria were random, non-random, or unknown. Table 2 shows the average maximum departure from the standard ratings and maximum departure with groups for AA and pygmy meters by selection-criteria category.

Table 2:--Number, average maximum departure, and maximum departure within group for meters, by type and selection category, that failed to meet standard-rating criteria.


AA Meters Pygmy Meters

All Random Non-Random Unknown All Random Non-Random Unknown
Number
36
26
7
3
21
18
2
1
Average
maximum
departure,
in percent
1.76
1.73
1.87
1.67
5.02
5.07
4.65
5.00
Maximum
departure
in group,
in percent
2.7
2.7
2.4
1.8
23.2
23.2
6.5
5.0

Conclusions and Recommendations

New meters, and those repaired and correctly adjusted, generally calibrate within a very small standard error of the standard ratings. Sauer and Myer (1992) defined the standard error contributed by the current meter at velocities commonly measured. They used a standard error of 0.3 percent for velocities of 2.3 feet per second and higher for AA meters, based on the results in Smoot and Carter (1968). The Meter-Exchange Program data show average maximum deviations from the standard rating for AA meters that failed to be 1.76 percent at velocities of 2.2 feet per second and above. This result is nearly six times higher than 0.3 percent used in Sauer and Meyer's equations for 2.3 feet per second and higher.

This contrast, however, is between differing things: the data cited in Sauer and Meyer are from an entire population of current meters; the data from the meter-change program are just those meters that failed a criteria. Nevertheless, 35 percent of the AA meters did fail, and those meters were, in nearly all cases, being used regularly to measure discharge, defining stage-discharge ratings.

Similarly, Sauer and Myer, based on data from Schneider and Smoot (1976), used standard errors from a standard rating by pygmy meters that ranged from 5.14 percent at 0.25 feet per second to 1.42 percent at 3.0 feet per second. In contrast, pygmy meters that were tested in the Meter-Exchange Program differed from the standard rating by as much as 23.2 percent at 0.25 feet per second to 6.0 percent at 3.0 feet per second.

Effect on Discharge Measurement Error

For AA meters Sauer and Meyer compute the overall error of examples of good cable-suspension and wading measurement at 2.4 percent and 2.3 percent, respectively. Had the average error (1.63 percent) of the 25 AA meters that failed to meet the standard-rating criteria at 2.2 feet per second been used, the error of these measurements would have increased to 2.9 percent for the cable-suspension example and 2.8 percent for the wading example.

The worst case of a AA meter failing to meet the criteria was 2.7 percent from the standard rating. Had this error been used in the two examples above, the overall measurement error would increase to 3.6 percent for both the cable-suspension and wading measurements.

For pygmy meters Sauer and Meyer compute the overall error of an example of a good wading measurement to be 4.0 percent. This example used an average velocity of 1.5 feet per second. Nineteen pygmy meters in the Meter-Exchange Program failed at this velocity. The average maximum departure of these 19 meters from the standard rating is 3.2 percent and the worst is 9.3 percent. These errors would have resulted in an increase in the overall error of the example pygmy meter wading measurement to 4.0 and 10.1 percent, respectively.

Conclusions

The Meter-Exchange Program data show that 35 percent of the AA meters and 20 percent of the pygmy meters fail to meet the standard-rating criteria. At about 2 standard deviations, these criteria are quite generous. Only about 2 percent of the meters should fail. Thus, the rate of failure is much higher than ideal.

Even though the failure rate is high, the resultant error is not large. For the more consistent AA-meter data, it is very unusual to find a meter that departs from the standard rating more than 2.3 percent at velocities ranging from 0.75 to 8.00 feet per second. For pygmy meters the comparable figure is a little harder to pick, but only 2 meters, out of 104, exceeded a departure from the standard rating of 5.0 percent in this range of discharges.

Meter error is only one of the errors encountered in measuring discharge. For this reason meter error has to be relatively large to really push the overall error of a discharge measurement over the +/- 5 percent, usually assumed for "good" conditions. For velocities of 0.75 to 8.00 feet per second it would be very unlikely for the kind of errors seen in the Meter-Exchange Program to cause a measurement made with a AA meter under good conditions to have an overall error exceeding 5 percent. It would be somewhat unlikely for the error to exceed 5 percent, when using a pygmy meter under similar conditions. For worse conditions, except for low velocities, the meter error would have even less influence on the overall error of the discharge measure.

Be that as it may, where a hydrographer consistently uses a meter that has a departure from the standard rating of 2, 3, or 5 percent at a gaging station, the stage-discharge rating for that gage will have a bias of 2, 3, or 5 percent. The bias could add up to a thousands of acre-feet of water that were unaccounted for or were reported but were not there. The bias could throw off a National Weather Service flood forecast or mislead other users of USGS data. The USGS has an obligation to reduce these biases, if it can reasonably do so.

The Meter-Exchange Program tested 208 meters in the 9-year period since its inception--about 11 or 12 meters per year of each type. This annual sample is too small to evaluate whether the performance of meters used in the field is getting better or worse. The sample is also too small over a period of a few years to identify causative factors in meters failing the standard-rating criteria. Nor do district reviewers presently collect the data needed to help identify causative factors for the problems in the meters they select, which might include age, amount or frequency of use, conditions under which used, care procedures, etc. The entire sample is too small to really differentiate among some selection-criteria categories. For example, table 2 shows 4 categories that have data for only 7, 3, 2, and 1 meters. The averages from these categories are probably not statistically valid for comparison with averages in other categories based on the data from 21, 26, or 36 meters.

Meters returned to the hydraulic laboratory and tested have almost always been returned to the Meter-Exchange Program after repairs and adjustment. The subsequent calibration testing has shown these meters meet the standard-rating calibration. Although appearance and spin tests are poor indicators of whether a meter will meet the standard-rating criteria, some of the adjustment and repairs could be done in the field by well-trained hydrographers. Analysis of recent district reviews, however, have shown that field personnel in a number of districts are poorly trained in the care and repair of current meters (C. Russell Wagner, written communication).They typically cannot completely disassemble a current meter, have only a rudimentary knowledge of meter repair and adjustment, and do not have the tools or knowledge to check for damage to the yoke or internal bearings. Better knowledge of current-meter maintenance could solve some but not all of the problems found. Precise tow-tank testing is sometimes necessary to detect or fix problems with current meters.

Recommendations

1. The Meter-Exchange Program should be expanded to become a comprehensive quality-assurance program for meters as they are being used in the field. It should be designed to accomplish the following goals:

There is excess capacity in the hydraulic laboratory, which could be used to achieve this expanded program. Even though the excess laboratory capacity must be supported by division funds regardless, the expanded Meter-Exchange Program might cost only 10 to 15 dollars per gage, depending on how many meters should be tested each year to achieve the goals.

2. The training received by hydrographers on the care, repair, and adjustment of current meters should be increased. This training should be designed to:

The training during district reviews would only have to run one 3-year cycle of reviews and could be reduced or phased out after most of the field people had been exposed to the course. Regional courses would be a very good vehicle to provide training, because they can be brought to the locations and include the people most needing the instruction. Meter training might be offered as part of or following the Senior Technicians Seminar at the National Training Center. From the data resulting from the Meter Exchange Program, it is probable that on-the-job training of hydrographers in this area is lacking.

REFERENCES

Schneider, V. R., and Smoot, G. F., 1976, Development of a standard rating for the Price Pygmy current meter: U.S. Geological Survey Journal of Research, vol. 4, no. 3 p. 293-297.

Smoot, G. F., and Carter, R. W., 1968, Are individual current meter ratings necessary? American Society of Civil Engineers Journal of the Hydraulics Division, 94 (HY2), p. 391-397.

Sauer, V. B., and Meyer, R. W., 1992, Determination of error in individual discharge measurements: U.S. Geological Survey, Open-File Report 92-144, p.


[an error occurred while processing this directive]
[an error occurred while processing this directive]