PROVISIONAL DATA SUBJECT TO REVISION
Click to hidestation-specific text
Funding for this site is provided by:
 Site Information
LOCATION.--Lat 42°40'49.0", long
78°52'43.3" referenced to North American Datum of
1983, Erie County, NY, Hydrologic Unit 04120103, in the village
of Hamburg, about 7.1 mi upstream of Lake Erie.
DRAINAGE AREA.--36.6 mi².
PERIOD OF RECORD.--September 2017 to current year.
REVISIONS HISTORY.--Discharge above about 1,400 ft³/s for the period of Sept. 19, 2017, to Mar. 1, 2021, was revised on Feb. 14, 2022, based on changes to the stage-discharge rating.
GAGE.--Water-stage recorder and crest-stage gage. Datum of gage is 734.14 ft above NAVD of 1988.
REMARKS.--Water Years 2017-23: Records good except those for estimated daily discharges, which are poor.
EXTREMES FOR PERIOD OF RECORD.--Maximum discharge, 4,280 ft³/s, Nov. 5, 2017, gage height 10.50 ft, from rating curve extended above 1,400 ft³/s on basis of slope-area measurement at gage height 8.46 ft; minimum discharge, 0.22 ft³/s, July 15, 2022, gage height 2.78 ft.
 WaterAlert – get an
email or text (SMS) alert based on your chosen threshold.
WaterAlert – get an
email or text (SMS) alert based on your chosen threshold.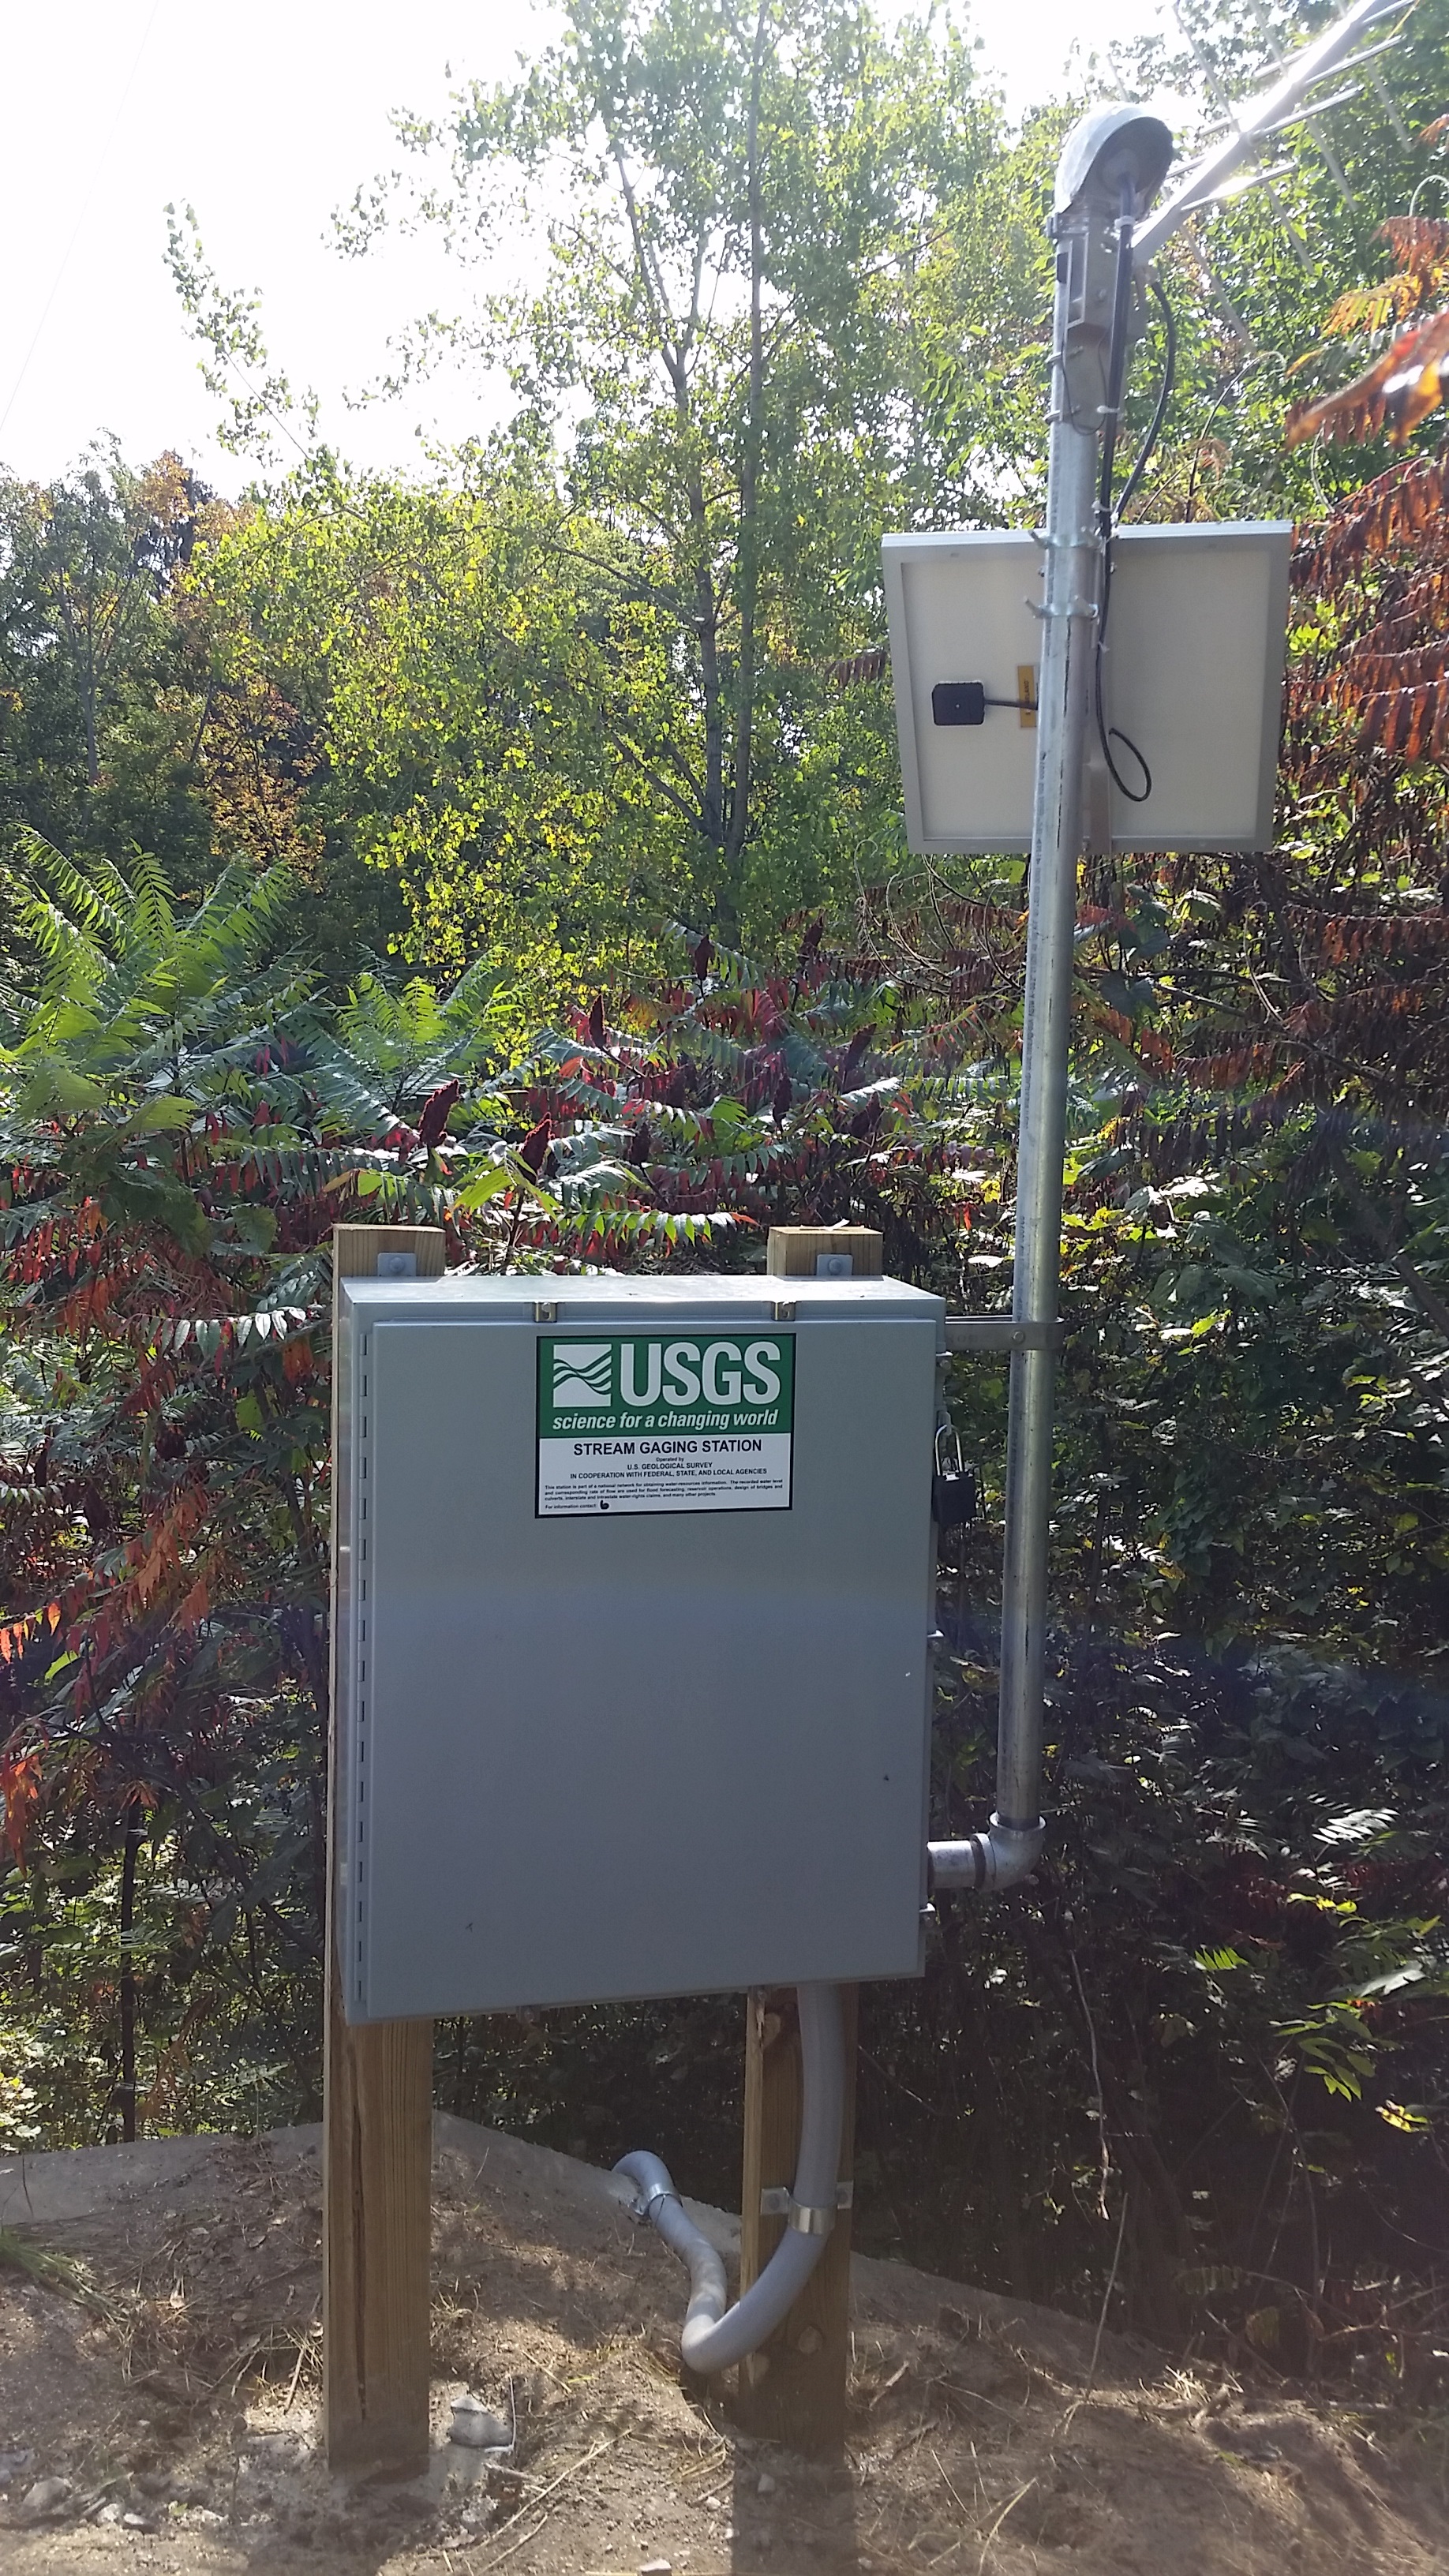 Station image
Summary of all available data for this site
Instantaneous-data availability statement

