PROVISIONAL DATA SUBJECT TO REVISION
Click to hidestation-specific text
The 15-minute precipitation data for this
station are temporary and will only be displayed for 120 days.
Although the instrumentation is calibrated at least once/year, the
temporary classification means that documented routine inspections and
other quality assurance measures are not performed that would make the
data acceptable for archival, retrieval, or future use in general
scientific or interpretive studies.
 Site Information
Funding for this site is provided by:
Site Information
LOCATION.--Lat 42°49'41.37", long
73°59'25.34" referenced to North American Datum of
1983, Schenectady County, NY, Hydrologic Unit 02020004, on
right bank 330 ft downstream of Lock 8 on the Erie (Barge)
Canal, 2.9 mi west of Schenectady.
DRAINAGE AREA.--3,270 mi².
PERIOD OF RECORD.--December 2011 to current year (gage heights only).
GAGE.--Water-stage recorder. Datum of gage is 199.46 ft above NAVD of 1988 and 200.00 ft above NGVD of 1929 (VERTCON). Prior to Oct. 1, 2013, datum of gage was 199.61 ft above NGVD of 1929, not 200.00 ft above NGVD of 1929 as previously published.
REMARKS.--Considerable regulation of stage by Lock 8 on the Erie (Barge) Canal about 330 ft upstream and Vischer Ferry Dam hydroelectric facility about 10.7 mi downstream.
Water Years 2014-22: Records fair.
EXTREMES FOR PERIOD OF RECORD.--Maximum gage height, 29.37 ft, Feb. 22, 2018 (ice jam); minimum gage height, 8.63 ft, Nov. 8, 2023.
EXTREMES OUTSIDE PERIOD OF RECORD.--Flood of Aug. 29, 2011, reached a stage of 33.02 ft, from floodmarks in downstream cabin of Lock 8 about 350 ft upstream, from information provided by New York State Canal Corporation.
PERIOD OF RECORD1.--April 2019 to current year.
PERIOD OF DAILY RECORD1.--WATER TEMPERATURE: April 2019 to current year.
SPECIFIC CONDUCTANCE: April 2019 to current year.
pH: April 2019 to current year.
DISSOLVED OXYGEN: April 2019 to current year.
TURBIDITY: April 2019 to current year.
INSTRUMENTATION1.--A multi-parameter water-quality sonde measures water temperature, specific conductance, pH, dissolved oxygen, and turbidity at 15-minute intervals since April 2019.
COOPERATION1.--Maintained by the Hudson River Environmental Conditions Observing System in cooperation with the New York State Department of Environmental Conservation.
EXTREMES FOR PERIOD OF DAILY RECORD1.--WATER TEMPERATURE: Maximum, 29.1°C, June 23, July 13, 2020; minimum, -0.2°C, Dec. 17 - 25, 2020, Jan. 9, 21, 23, Mar. 8, 9, 10, 2021.
SPECIFIC CONDUCTANCE: Maximum, 606 uS/cm @ 25°C, Mar. 1, 2021; minimum, 145 uS/cm @ 25°C, Nov. 2, 2019.
pH: Maximum, 9.0, June 4, July 10, 14, Aug. 25, 26, 2020; minimum, 7.5, July 7, 2021.
DISSOLVED OXYGEN: Maximum, 15.6 mg/L, Feb. 21, 2020; minimum, 5.2 mg/L, Aug. 25, 2020.
TURBIDITY: Maximum, 176 FNU, June 22, 2019; minimum, <0.3 FNU, on many days. [<, actual value is known to be less than the value shown]
1 Water-Quality Records
 WaterAlert – get an
email or text (SMS) alert based on your chosen threshold.
WaterAlert – get an
email or text (SMS) alert based on your chosen threshold.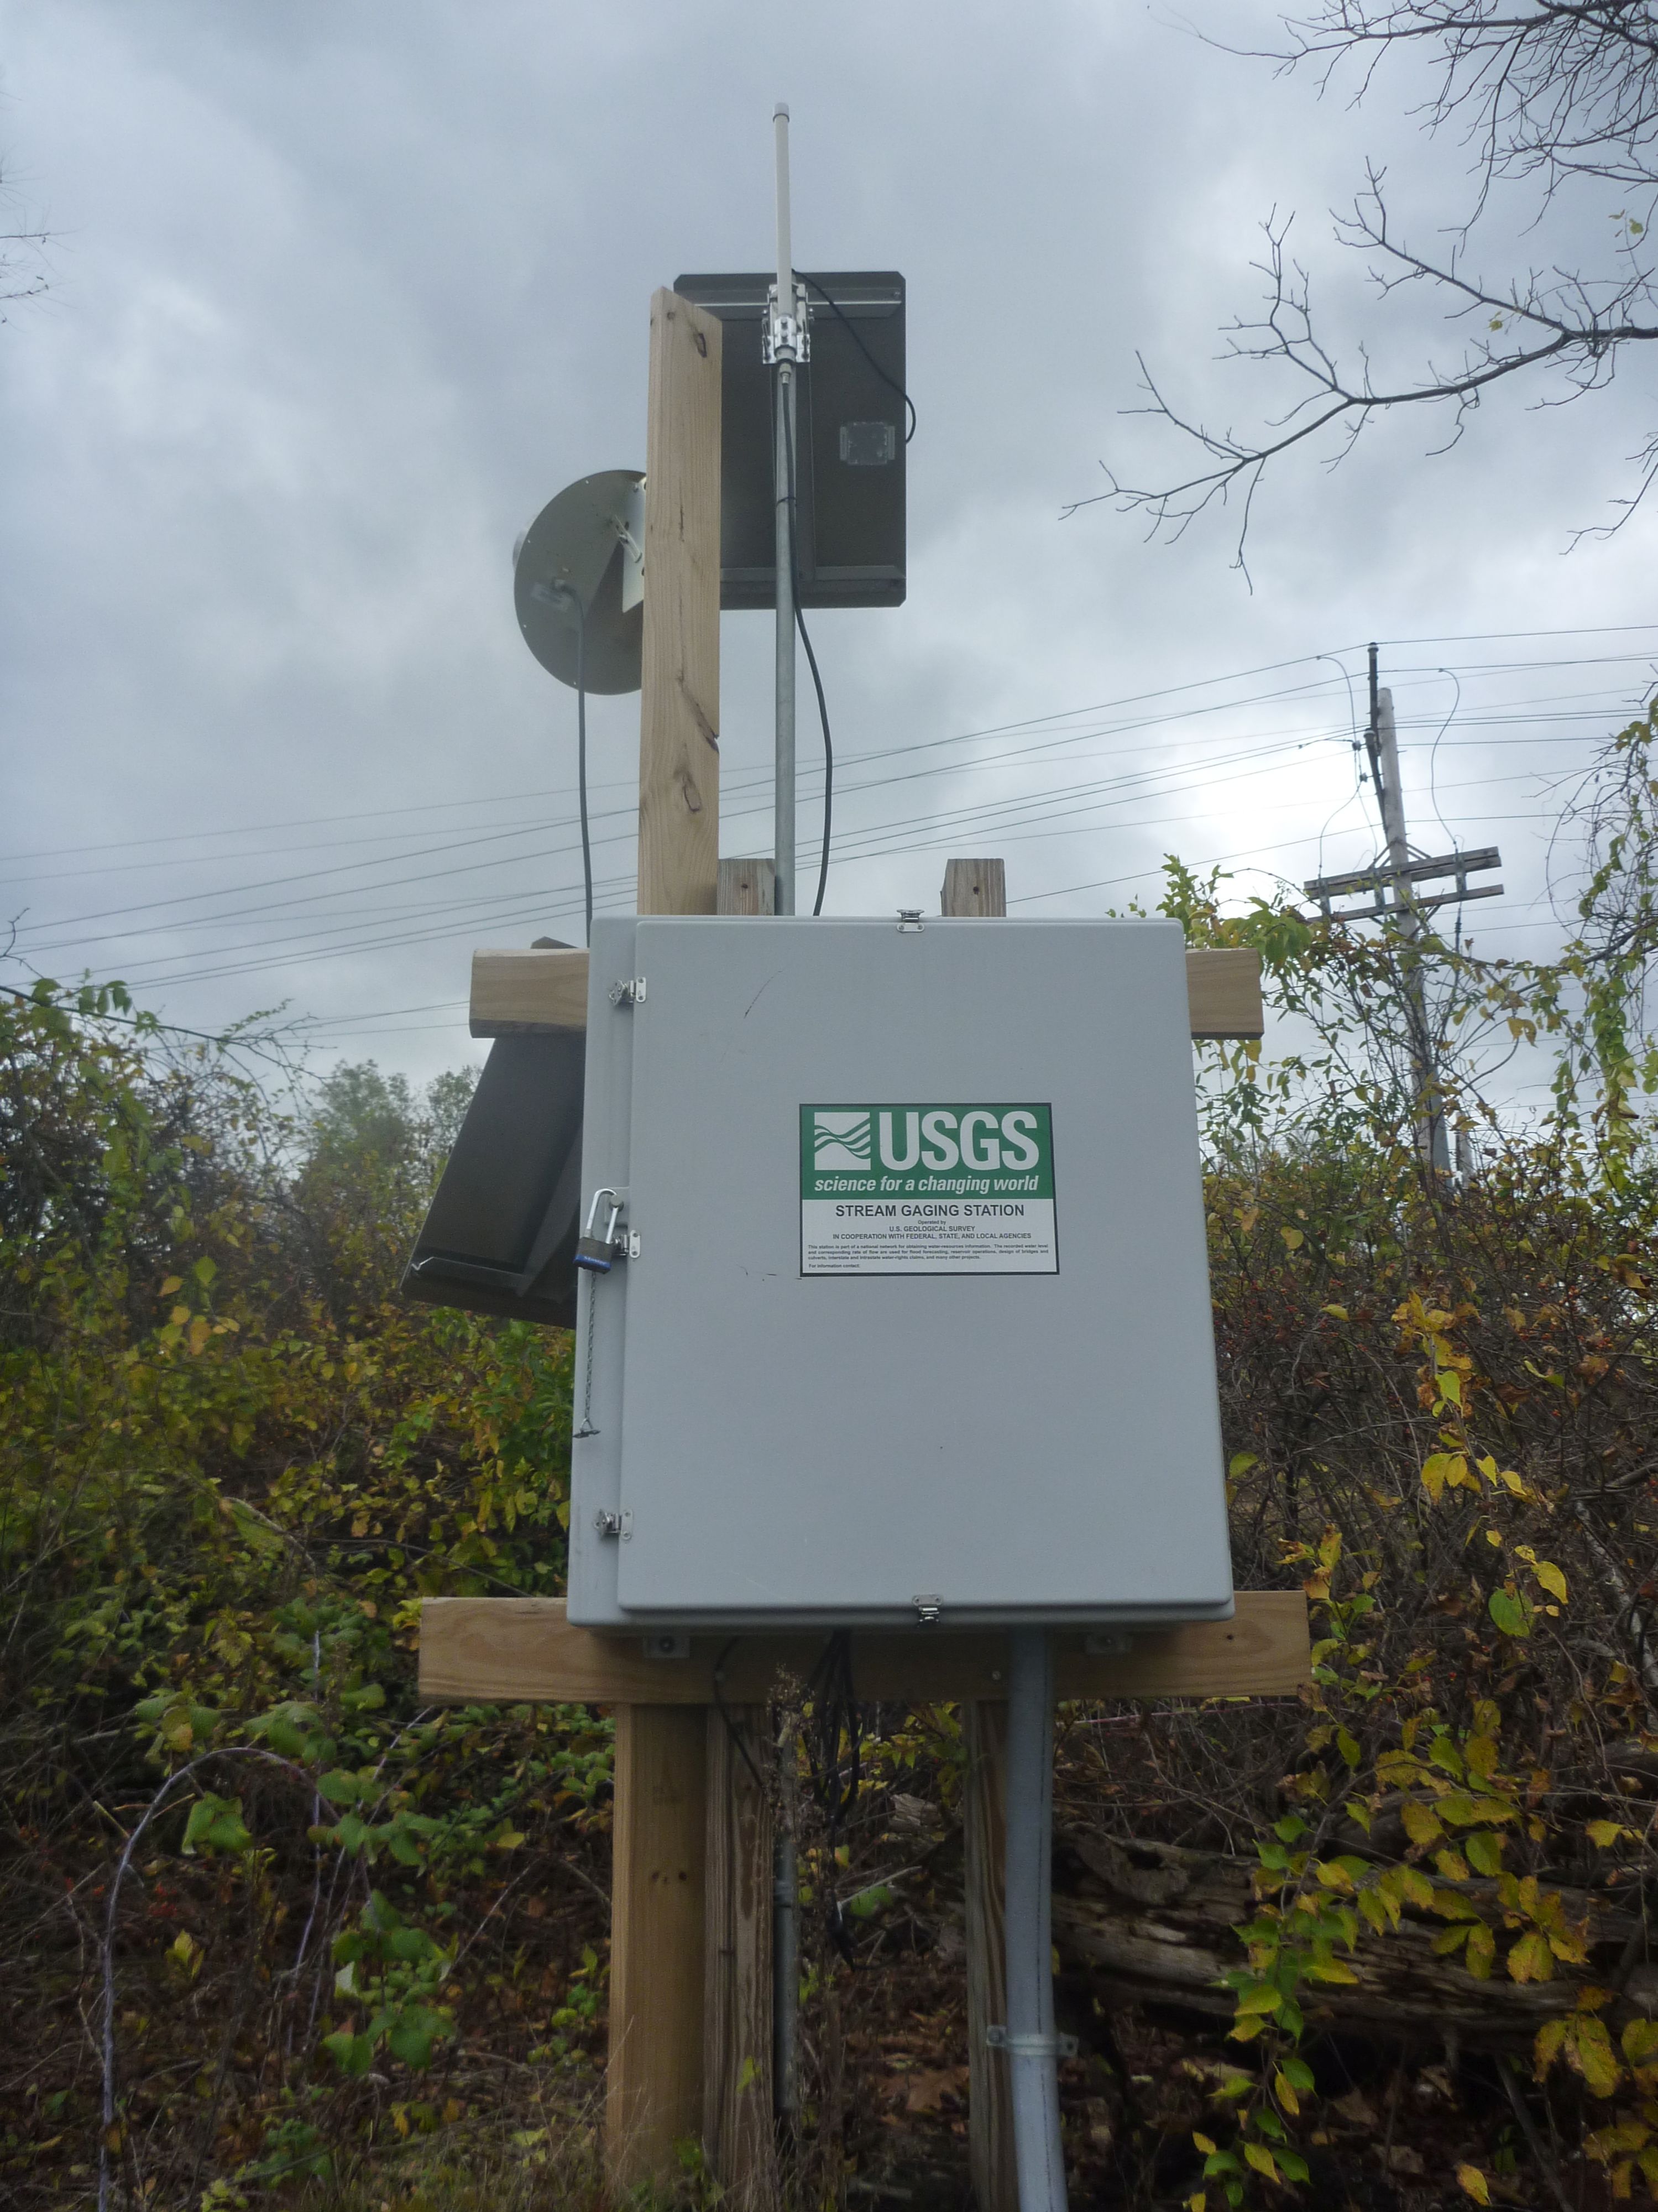 Station image
Summary of all available data for this site
Instantaneous-data availability statement


